
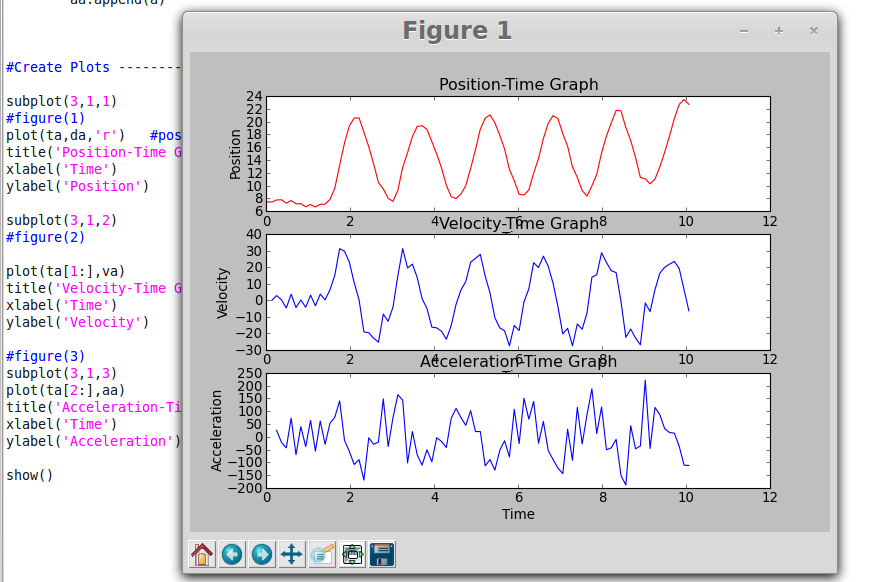
In most of the mechanics experiments we are trying to plot multiple graphs ( position, velocity and acceleration or kinetic energy and potential energy etc.) in one figure. In the figure the axis labels of two graphs are overlapping. These labels should have some spacing between them.
Today, while trying to solve this problem I got the information about tight-layout function from matplotlib (thanks to Google),
Here is the figure without tight-layout() function. The axis labels and titles are overlapped.
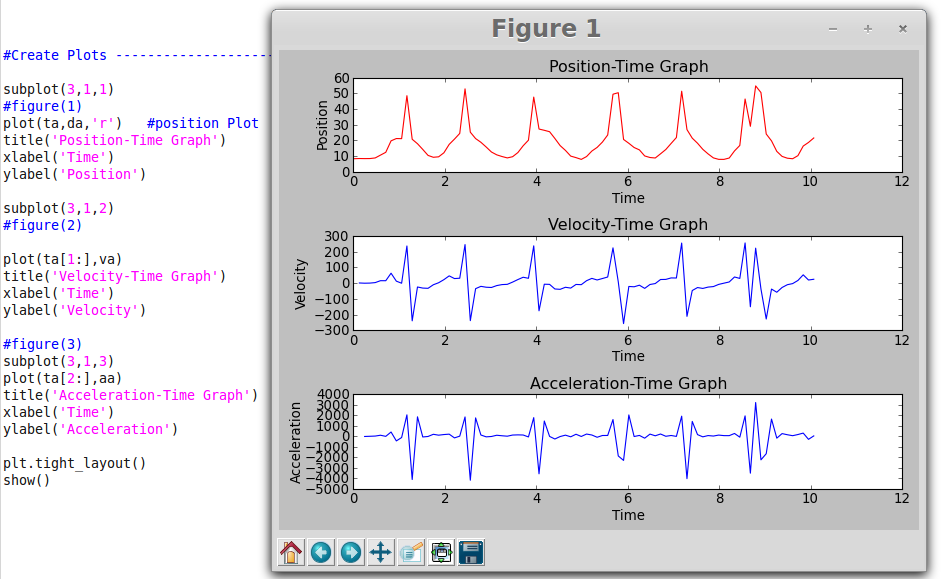
Sometimes it can happen that axis labels or titles (or sometimes even ticklabels) go outside the figure area, and are thus clipped. tight_layout() can prevent this and also adjust spacing between subplots to minimize the overlaps.
This figure is obtained using tight-layout() function…
Today I have gathered required apparatus for performing various experiments like resonance and oscillations. Next two days I will set-up almost all planned experiments for my GSoC project.