Python program ( srf3.py) to fetch data from srf module and plot graphs needed some modifications to plot velocity and acceleration graphs. Today we could re-write the program to calculate velocity and acceleration. The program also plots position, velocity and acceleration.
Now I am working on smoothing the graphs using filtering techniques. Wrote a program using Savitzky-Golay filtering ( From this source). I could remove all the errors in the program but not getting the plots. Need to work on it.
Here is the screenshot of graphs obtained.
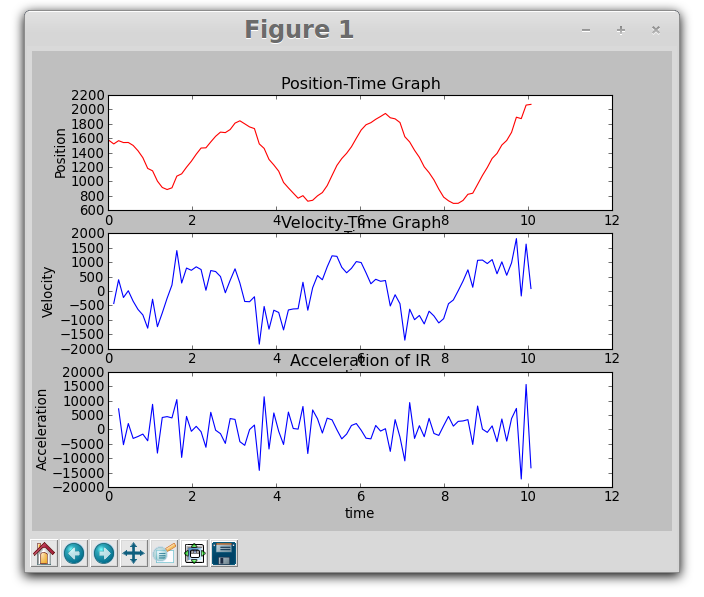
Velocity is calculated using numerical differentiation and acceleration is calculated as the second derivative of position with numerical methods. Wrote following code for velocity and acceleration. Committed the entire program to GIT Repo.
——————————————————————————————————
va = []
aa = []
for i in range(0,len(da)-1):
# Calculate Velocity
v = (da[i+1]-da[i])/(ta[i+1]-ta[i])
va.append(v)
#aa= diff(va)
# Calculate Acceleration
if i < len(da)-2:
a = (da[i+2]-2*da[i+1]+da[i])/((ta[i+2]-ta[i+1])*(ta[i+1]-ta[i]))
aa.append(a)
—————————————————————————————————-