Today is the “Firm Pencil Down Date ” of GSoC 2015. We are getting to the end of Google Summer of Code 2015….. An amazing journey with my mentors Mario Behling, Hong Phuc Dang and Andre Rebentisch at FOSSASIA, with some critical piece of knowledge or a new lesson to learn everyday….. This opportunity indeed is the most important thing happened to me.
I really had a lot of learning adventures with experimenting and exploring with new ideas to build sensor plug-ins for ExpEYES. There were some moments which were disappointing and there were some other moments which brought the joy of creating something new…
While doing my GSoC project work I have been closely observing the work done by my mentors especially Mario Behling and fellow GSoCers at Fossasia on projects like Loklak. Their continuous collaborative engagement and commitment to meet the deadlines and do quality work has inspired me to keep going, in odd times and continue to work on Pocket Science Lab even after GSoC.
Here is a brief narration of things we could do and things planned for the near future……
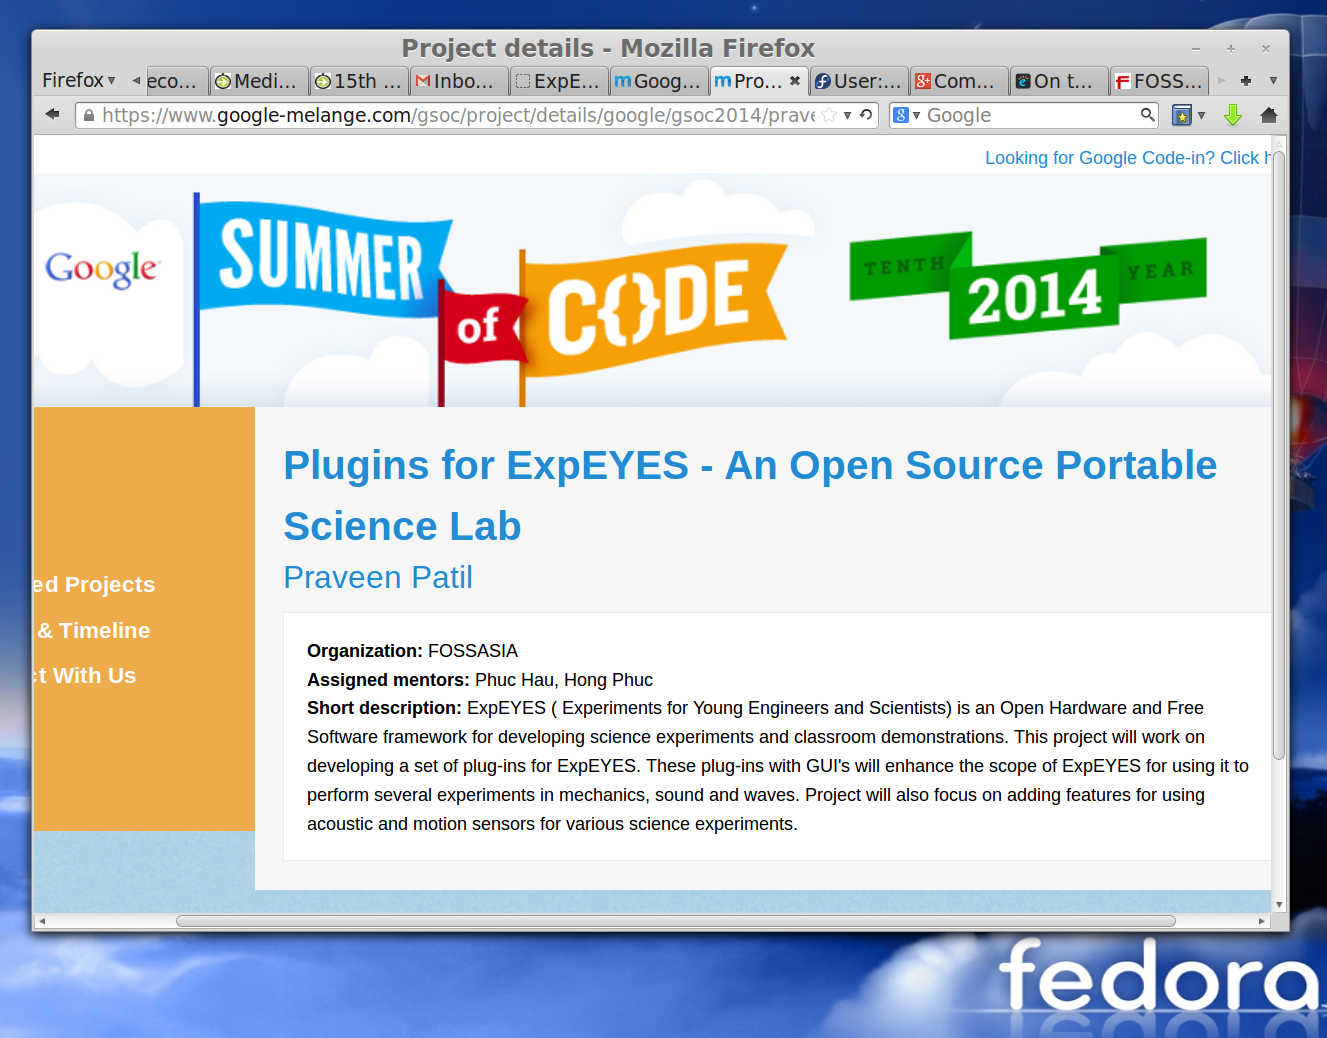
[wmd-toggle tab_background=”#75a5ce” tab_color=”#fff” content_background=”#93e9ea” content_color=”#725d53″ border_radius=”8″ ls-id=”55d9f88f982ec”][wmd-toggle-tab title=” GSoC-15 Project: Sensor Plug-ins, Add-on devices and GUI Improvements for ExpEYES”]Organization%3A%20FOSSASIA%0D%0AMentors%3A%20Hong%20Phuc%2C%20Mario%20Behling%2C%20Rebentisch%0D%0AAbstract%3A%20%0D%0AExpEYES%20is%20an%20Open%20Source%20Pocket%20Science%20Lab%20for%20developing%20science%20experiments%2C%20classroom%20demonstrations%20and%20a%20test%20equipment%20for%20electronics%20hobbyists.%20This%20proposal%20aims%20to%20improve%20the%20GUI%5C%27s%2C%20add%20new%20Sensor%20Plug-ins%20to%20measure%20various%20parameters%20and%20to%20enhance%20the%20scope%20of%20ExpEYES%20for%20using%20it%20to%20perform%20several%20new%20experiments%20with%20low%20cost%20devices.%20Our%20aim%20is%20also%20to%20develop%20a%20low-cost%20stand%20alone%20data%20acquisition%20system%20that%20can%20be%20used%20for%20weather%20monitoring%20or%20environmental%20studies.%0D%0A[/wmd-toggle-tab][/wmd-toggle]
The aim of my GSoC-2015 project is to develop new Sensor Plug-ins for ExpEYES to measure a variety of parameters like temperature, pressure, humidity, wind speed, acceleration, tilt angle, magnetic field etc. and provide low-cost, effective and open source laboratory equipment to students all over the world.
This development is intended to enhance the scope of ExpEYES for using it to perform several new experiments. Developing a low-cost stand alone data acquisition system that can be used for weather monitoring or environmental studies is another objective of our project.
I am happy to see that the things have taken good shape with additional gas sensors added which were not included in the initial plan and we have almost achieved all the objectives of the project, except for some difficulties in calibrating sensor outputs and documentation. This issue will be solved in a couple of days.
In the beginning, during community bonding period, I started exploring and experimenting with different sensors. After doing preliminary studies I procured analog and a few digital sensors for measuring weather parameters like temperature, relative humidity and barometric pressure. A few other sensors like low cost piezoelectric sensor, accelerometer ADXL-335, Hall effect magnetic sensor, Gyro-module etc were also added to my GSoC laboratory.
After the mid-term we decided to add gas sensors for detecting Carbon Monoxide, LPG and Methane. With this development ExpEYES can now be used for pollution monitoring and also in safety systems in Physics/chemistry laboratory. ( Work on low-cost Dust Sensor is under progress)
I had to spend a lot of time in getting the sensor components, studying their data sheets, soldering and setting them up with ExpEYES. And then little time in writing GUI Programs. After the mid-term, for two and a half week, unfortunately I could not give time for my GSoC work. But after that I started working almost 8 to 10 hours every evening after college hours (sometimes whole night .. ) and now things have taken good shape. Thanks to my mentor for pushing me…..sometimes with strict words…..
I could add many new sensor plug-ins to ExpEYES and now I will also be working on Light sensors so that the Pocket Science Lab can be used in optics. With these new sensor plug-ins one can replace many costly devices from Physics, Chemistry, Biology and also Geology Lab.
[wmd-toggle tab_background=”#75a5ce” tab_color=”#fff” content_background=”#93e9ea” content_color=”#725d53″ border_radius=”8″ ls-id=”55d9f950d96ea”][wmd-toggle-tab title=”My GSoC Gallery of Sensors and Devices “]…..%20[/wmd-toggle-tab][/wmd-toggle]
Here is the gallery of all the sensors I played with for PSLab..

The complete list of sensor plug-ins developed is here….
Below are the highlights of the work done……the description of the sensors used, GUI’s designed the code written and the possible applications.
( Updated on 23rd August 2015)
[wmd-toggle tab_background=”#75a5ce” tab_color=”#fff” content_background=”#93e9ea” content_color=”#725d53″ border_radius=”8″ ls-id=”55d999a91d3cb”][wmd-toggle-tab title=”Accelerometer”]An%20accelerometer%20is%20a%20device%20that%20measures%20proper%20acceleration%20%28%22g-force%22%29.%20Proper%20acceleration%20is%20not%20the%20same%20as%20coordinate%20acceleration%20%28rate%20of%20change%20of%20velocity%29.%20For%20example%2C%20an%20accelerometer%20at%20rest%20on%20the%20surface%20of%20the%20Earth%20will%20measure%20an%20acceleration%20g%3D%209.81%20m%2Fs2%20straight%20upwards.%20By%20contrast%2C%20accelerometers%20in%20free%20fall%20orbiting%20and%20accelerating%20due%20to%20the%20gravity%20of%20Earth%20will%20measure%20zero.[/wmd-toggle-tab][/wmd-toggle]
Sensor Used: ADXL-335
ADXL 335-GY-61 is a small, thin, low power, complete three-axis accelerometer voltage output through the signal conditioning at a minimum of full scale ± 3 g measurement range acceleration. It can measure the acceleration of gravity, and movement, shock or vibration due to dynamic acceleration.
Calibration is done on the optical bench (for perfect leveling) from Laser-Physics Lab of University and could get zero-g, +1 g and -1 g values. this is an essential step for using accelerometer for any experiment. The GUI for accelerometer is now ready with good calibration.

ADXL-335

ADXL-335 with ExpEYES
Three programs are written in python. The Code is here…
- The GUI for plotting acceleration for x,y and z axis in terms of ‘g’ in real time.
- Program for measuring tilt angle
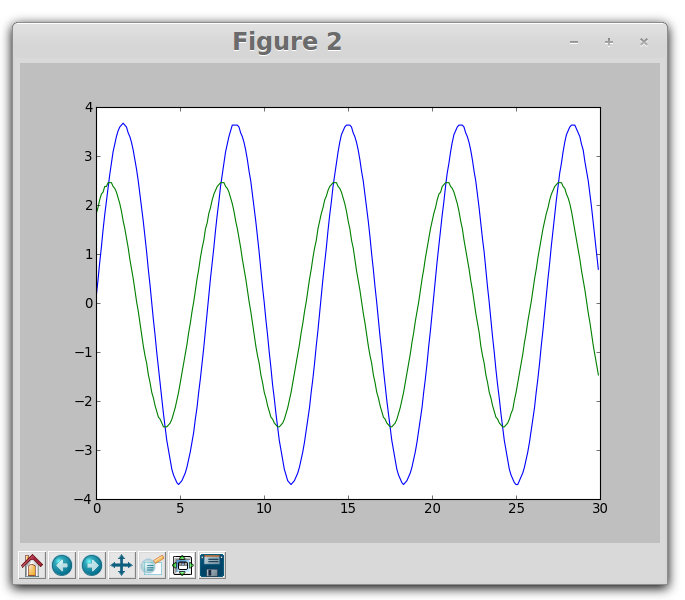
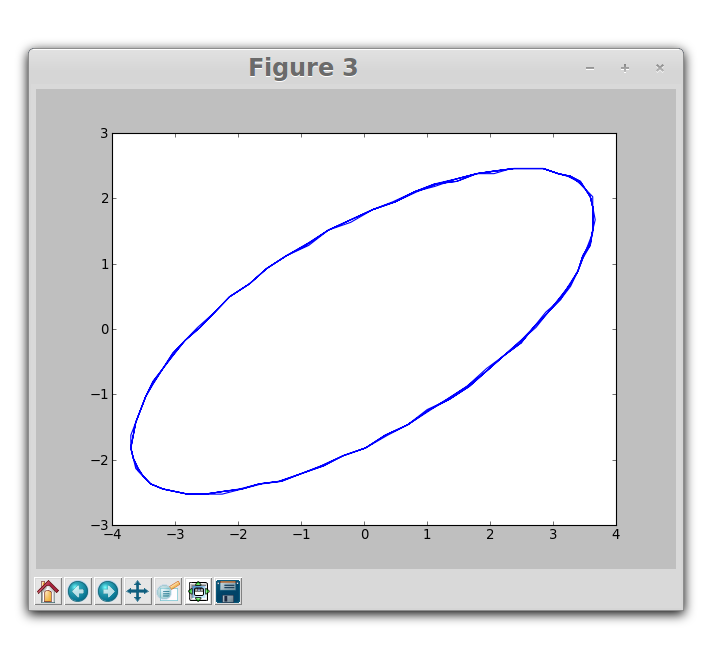
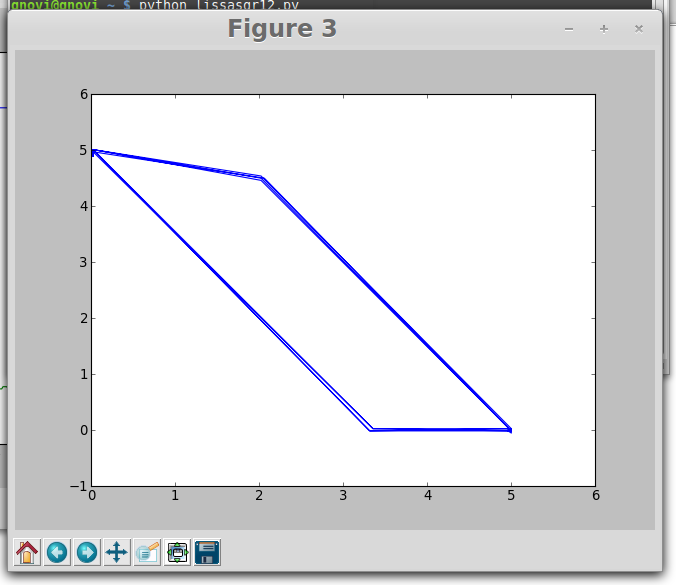
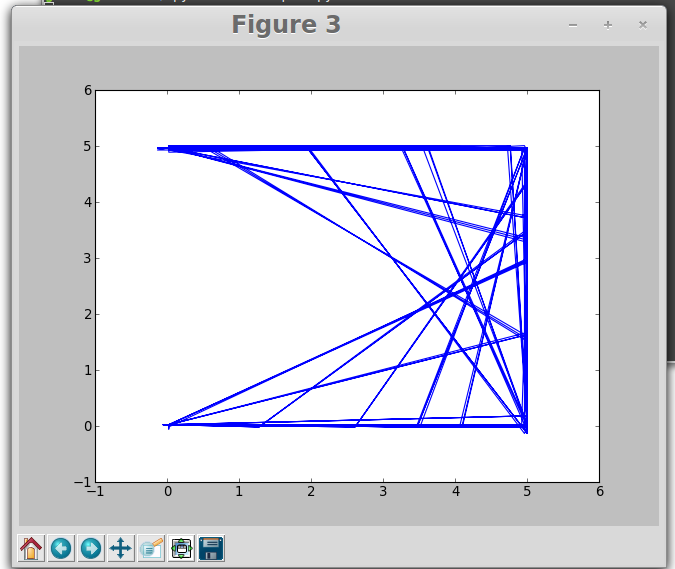
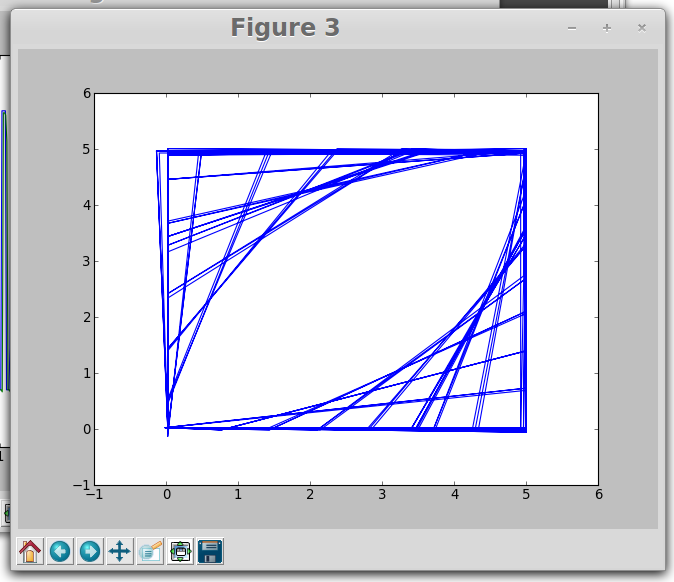
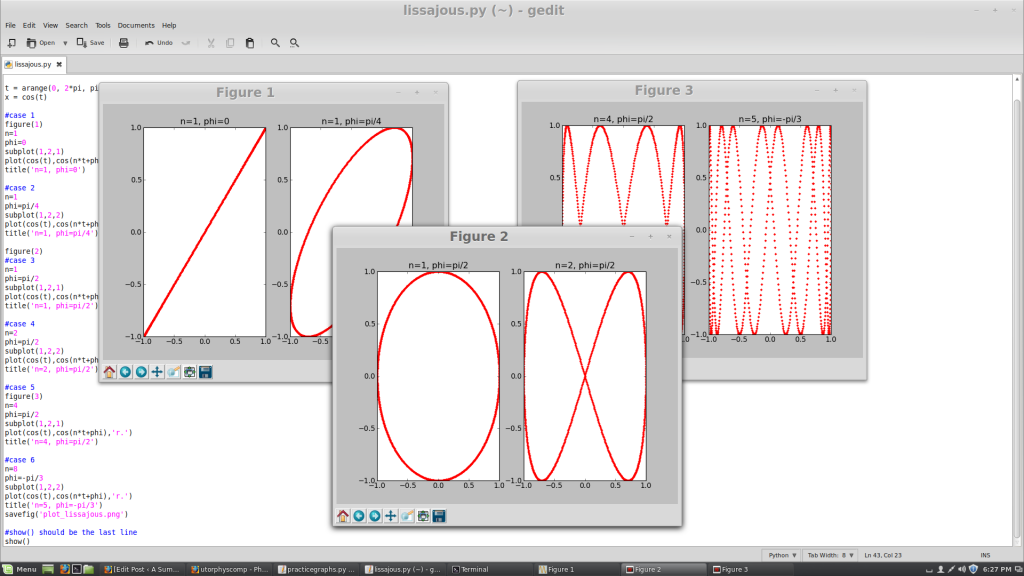
- GUI for plotting Lissajous Figures using accelerometer mounted on an oscillating system
This module is useful for in determination of acceleration, measuring tilt angle and many mechanics experiments.

Accelerometer : sensor randomly moved to obtain plots
[wmd-toggle tab_background=”#75a5ce” tab_color=”#fff” content_background=”#93e9ea” content_color=”#725d53″ border_radius=”8″ ls-id=”55d9a2958c08d”][wmd-toggle-tab title=”Relative Humidity Sensor”]Relative%20humidity%20is%20an%20important%20metric%20used%20in%20weather%20forecasts%20and%20reports%2C%20as%20it%20is%20an%20indicator%20of%20the%20likelihood%20of%20precipitation%2C%20dew%2C%20or%20fog.%20In%20hot%20summer%20weather%2C%20a%20rise%20in%20relative%20humidity%20increases%20the%20apparent%20temperature%20to%20humans%20%28and%20other%20animals%29%20by%20hindering%20the%20evaporation%20of%20perspiration%20from%20the%20skin.%20%20Ref%3A%20wikipedia.org[/wmd-toggle-tab][/wmd-toggle]
HS1101 sensor consists of a capacitor which varies with relative humidity and is used in a 555 circuit to generate a pulse train of frequency related to relative humidity. The number of pulses over a one second period are counted and the RH is then calculated.
Based on a unique capacitive cell, this relative humidity sensor is designed for high volume, cost sensitive applications such as office automation, automotive cabin air control, home appliances, and industrial process control systems. They are also useful in all applications where humidity compensation is needed.

Humidity sensor HS-1101

Humidity-Temperature Sensor DHT-11
( Tried some other humidity sensors including DHT-11. Tried DHT-11 with MicroHope and Raspberry-pi . HS-1101 is low-cost and found most suitable for ExpEYES)
Trials with HS1101 for measuring humidity are successful. Tried by three different methods:
- Frequency output circuit using timer 555
- Proportional voltage output circuit
- Direct capacity measurement using ExpEYES
ExpEYES has ability to measure capacitance of the order of few pF. Therefore decided to to go for third method as it gives better accuracy.
The python program is written for calculating humidity from capacity measurement. This can be used for various other experiments. The GUI program enables user to plot capacity in pico-farad and relative humidity in % in real time. This module is also added to weather station GUI.
The Code is here…

Humidity: changed by blowing air through mouth (humidity increases) and then by blowing hot air using dryer (humidity decreases)
[wmd-toggle tab_background=”#75a5ce” tab_color=”#fff” content_background=”#93e9ea” content_color=”#725d53″ border_radius=”8″ ls-id=”55d9b453979f0″][wmd-toggle-tab title=”Temperature Sensors”]Platinum%20resistance%20thermometers%20%28PRTs%29%20offer%20excellent%20accuracy%20over%20a%20wide%20temperature%20range%20%28from%20%E2%80%93200%20to%20%2B850%20%C2%B0C%29.%20Standard%20sensors%20are%20are%20available%20from%20many%20manufacturers%20with%20various%20accuracy%20specifications%20and%20numerous%20packaging%20options%20to%20suit%20most%20applications.%20Unlike%20thermocouples%2C%20it%20is%20not%20necessary%20to%20use%20special%20cables%20to%20connect%20to%20the%20sensor.%0D%0A%0D%0AThe%20LM35%20series%20are%20precision%20integrated-circuit%20temperature%20sensors%2C%20whose%20output%20voltage%20is%20linearly%20proportional%20to%20the%20Celsius%20%28Centigrade%29%20temperature.%20The%20LM35%20thus%20has%20an%20advantage%20over%20linear%20temperature%20sensors%20calibrated%20in%20%CC%8A%20Kelvin%2C%20as%20the%20user%20is%20not%20required%20to%20subtract%20a%20large%20constant%20voltage%20from%20its%20output%20to%20obtain%20convenient%20Centi-%20grade%20scaling.%20%0D%0A[/wmd-toggle-tab][/wmd-toggle]
Sensors Used LM-35 and PT-100
For LM-35 temperature sensor the output voltage is linearly proportional to the Celsius (Centigrade) temperature. LM35 does not require any external calibration or trimming to provide typical accuracies of ±1⁄4̊ C at room temperature and ±3⁄4̊C over a full −55 to +150 ̊C temperature range. Another temperature sensor PT100 is previously tested with ExpEYES. It offers excellent accuracy over a wide temperature range (from –200 to +850 °C). Made modifications in GUI program for using PT100.
GUI program is written to interface LM35 with ExpEYES and measure temperature in Celsius and Fahrenheit. It plots temp.vs time graph in real time. These modules can be used for a variety of experiments involving temperature measurements.
The Code is here…

Temperature Sensor PT-100

LM-35 Temperature Sensor with ExpEYES

Plot shows temperature changes while hot air is blown on the sensor
[wmd-toggle tab_background=”#75a5ce” tab_color=”#fff” content_background=”#93e9ea” content_color=”#725d53″ border_radius=”8″ ls-id=”55d9bf7fc9dc2″][wmd-toggle-tab title=”Weather Station”]A%20weather%20station%20is%20a%20facility%2C%20either%20on%20land%20or%20sea%2C%20with%20instruments%20and%20equipment%20for%20measuring%20atmospheric%20conditions%20to%20provide%20information%20for%20weather%20forecasts%20and%20to%20study%20the%20weather%20and%20climate.%20The%20measurements%20taken%20include%20temperature%2C%20barometric%20pressure%2C%20humidity%2C%20wind%20speed%2C%20wind%20direction%2C%20and%20precipitation%20amounts.%20%20%20Ref%3A%20Wikipedia[/wmd-toggle-tab][/wmd-toggle]
The sensor plug-ins for temperature, pressure, humidity and wind speed etc are combined to make all these measurements simultaneously. The GUI program is written to plot data in real time. Trials to fetch weather data by connecting ExpEYES to Raspberry-pi are successful. Now calibration of anemometer readings is to be done.
Next immediate goal for this work is to complete calibration and do a pilot project to collect weather data in our college campus. Another important thing that we will try is to push the weather data to Loklak server and display it on the map. I will be trying to replace three cup anemometer with pc fan anemometer. I think it may provide stability and better accuracy.
The Code is here…

Random data to show sensitivity of the sensors connected
[wmd-toggle tab_background=”#75a5ce” tab_color=”#fff” content_background=”#93e9ea” content_color=”#725d53″ border_radius=”8″ ls-id=”55da062ee4422″][wmd-toggle-tab title=”Auto Tweeting Weather Data from PSLab using tweepy”]Python%20is%20great%20language%20for%20all%20sorts%20of%20things.%20Very%20active%20developer%20community%20creates%20many%20libraries%20which%20extend%20the%20language%20and%20make%20it%20easier%20to%20use%20various%20services.%20One%20of%20those%20libraries%20is%20tweepy.%20Tweepy%20is%20open-sourced%2C%20hosted%20on%20GitHub%20and%20enables%20Python%20to%20communicate%20with%20Twitter%20platform%20and%20use%20its%20API.%0D%0A%0D%0A%0D%0ARef%3A%20%20http%3A%2F%2Fpythoncentral.io%2Fintroduction-to-tweepy-twitter-for-python%2F[/wmd-toggle-tab][/wmd-toggle]
Wrote a python program to fetch weather data and auto-tweet using tweepy module. Using this program one can auto-tweet data at desired intervals of time. ExpEYES with Raspberry-pi is now a low-cost stand-alone portable weather station… 🙂
Link to the code on git-hub….

Auto-tweeting weather data from PSLab – Trials with temperature and humidity sensor
[wmd-toggle tab_background=”#75a5ce” tab_color=”#fff” content_background=”#93e9ea” content_color=”#725d53″ border_radius=”8″ ls-id=”55d9cfd10a373″][wmd-toggle-tab title=”Hall Magnetic Sensor”]A%20Hall%20effect%20sensor%20is%20a%20transducer%20that%20varies%20its%20output%20voltage%20in%20response%20to%20a%20magnetic%20field.%20Hall%20effect%20sensors%20are%20used%20for%20proximity%20switching%2C%20positioning%2C%20speed%20detection%2C%20and%20current%20sensing%20applications.%0D%0A%0D%0ARef%3A%20Wikipedia[/wmd-toggle-tab][/wmd-toggle]
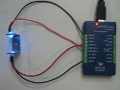
Sensor Used : Hall Sensor -3144 and Module KY-003
Exploring the use of this magnetic sensor for measuring rotational speed of anemometer and other measurements was quiet interesting experience. Tried Hall sensor 3144 and KY-003 module.
The KY-003 is a magnetic switch. If no magnetic field is present, the signal line of the sensor is HIGH (3.5 V). If a magnetic field is presented to the sensor, the signal line goes LOW, at the same time the LED on the sensor lights up. The polarity of the magnetic field is of influence to the switching action. The front side of the sensor needs the opposite polarity as the back of the sensor to switch on.
The GUI for Hall Magnetic Sensor module KY-003 is ready and tested. This will be useful in a range of measurement functions including proximity switching, positioning, speed detection, and current sensing applications.
I am now working on modifying the program to use it for speed detection of motors fans and also for measuring periodic time in oscillating systems. This is a low-cost solution for many oscillation experiments.. 🙂
The code for Magnetic Sensor is
here.

KY-003 Module and a3144 Sensors

Magnetic Sensor with a rotating magnet with ExpEYES

KY-003 Sensor – Plot with a rotating magnet near it.
[wmd-toggle tab_background=”#75a5ce” tab_color=”#fff” content_background=”#93e9ea” content_color=”#725d53″ border_radius=”8″ ls-id=”55d9d97704535″][wmd-toggle-tab title=”Gas Sensors”]Methane%20Gas%20Sensor%20MQ-4%0D%0AThis%20semiconductor%20gas%20sensor%20detects%20the%20presence%20of%20methane%20%28CNG%29%20gas%20at%20concentrations%20from%20300%20ppm%20to%2010%2C000%20ppm%2C%20a%20range%20suitable%20for%20detecting%20gas%20leaks.%0D%0A%0D%0ALPG%20Gas%20Sensor%20MQ-6%0D%0AThis%20%20sensor%20detects%20the%20presence%20of%20LPG%2C%20isobutane%2C%20and%20propane%20at%20concentrations%20from%20300%20to%2010%2C000%20ppm.%20%0D%0A%0D%0ACarbon%20Monoxide%20Gas%20Sensor%20MQ-7%0D%0AThis%20gas%20sensor%20detects%20the%20presence%20of%20Carbon%20Monoxide%20at%20concentrations%20from%2010%20to%2010%2C000%20ppm.[/wmd-toggle-tab][/wmd-toggle]
Recently while I was thinking on what new sensors can be added to ExpEYES, I remembered our conversations with Roland Turner and his Yahi Project during FOSSASIA. I started exploring use of Gas sensors for environmental monitoring.
Procured and tried following sensors…
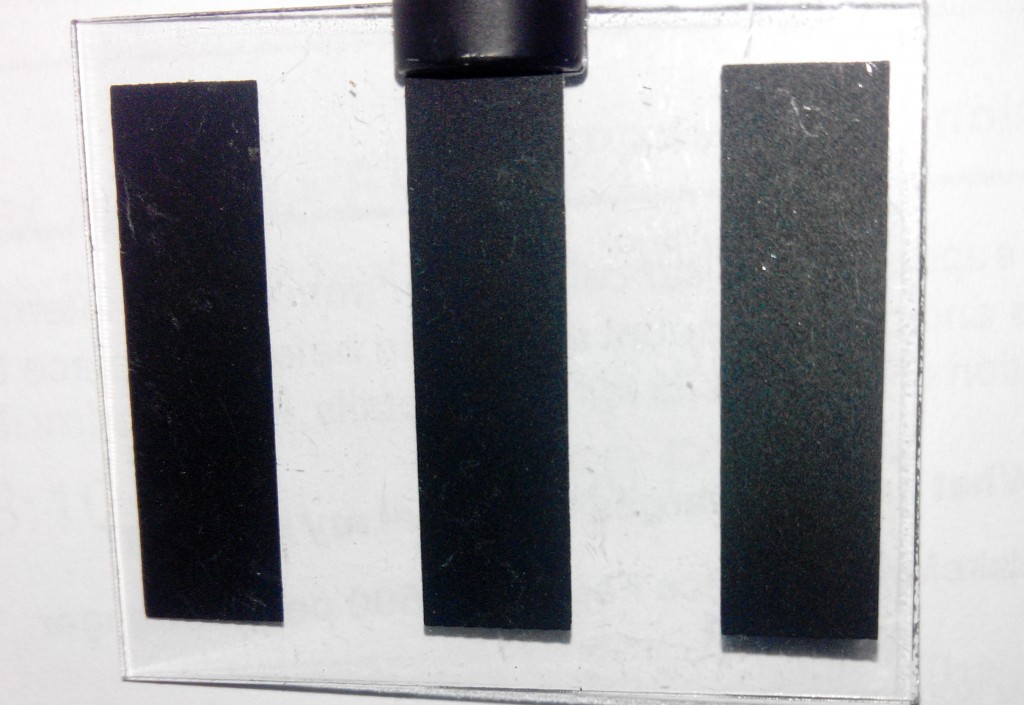
1. MQ-7 : Carbon Monoxide Gas Sensor
2. MQ-6 : LPG Gas Sensor
3. MQ-4 :Methane Gas Sensor

MQ-7 with Break-out board

MQ-6 and MQ-4 Gas Sensors with Break-out board
Soldered these sensors on separate breakout boards and wrote a python program to interface them with ExpEYES. Completed GUI programs for Gas Sensors MQ-4, MQ-6 and MQ-7 and also wrote a program for common GUI. Tested the program with LPG and smoke from vehicle exhaust. Things are working as expected. Need to calibrate this set-up with a standard equipment, which I will be doing later.
This new development has brought many new possibilities of using ExpEYES in many other fields like chemistry and environmental studies.
Next To Do.
1.Calibration to get readings in ppm
2. Add Dust sensor
3. PH sensor ( Currently not able to do it because low cost sensors are not available. Searching for alternatives)

Gas Sensors GUI tested for carbon monoxide (MQ-7) by generating smoke using a match stick.
[wmd-toggle tab_background=”#75a5ce” tab_color=”#fff” content_background=”#93e9ea” content_color=”#725d53″ border_radius=”8″ ls-id=”55d9de5ba9390″][wmd-toggle-tab title=”Modification in GUI\’s “/][/wmd-toggle]
Modifications in Existing GUI’s developed during GSoC-14
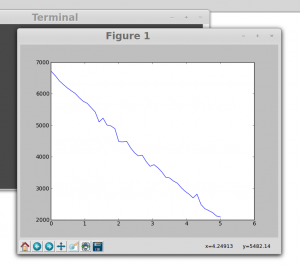
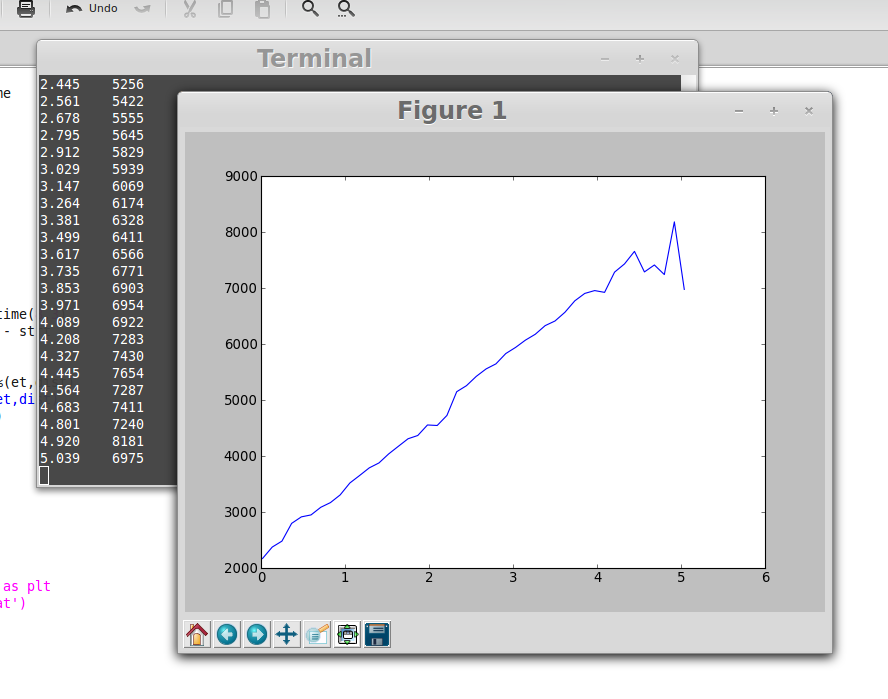
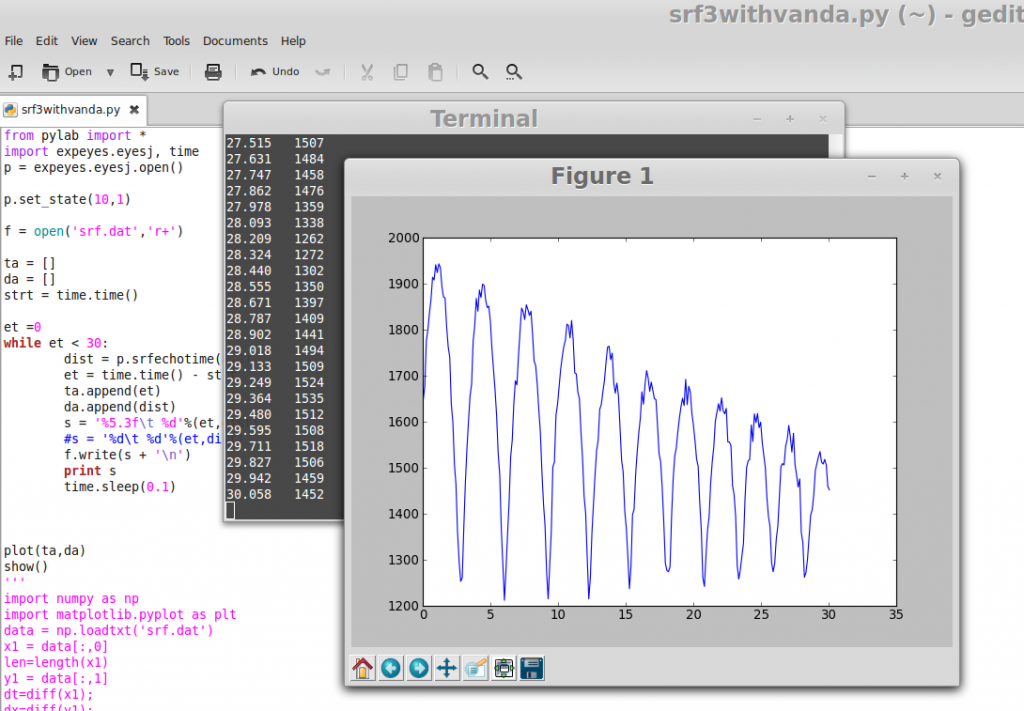
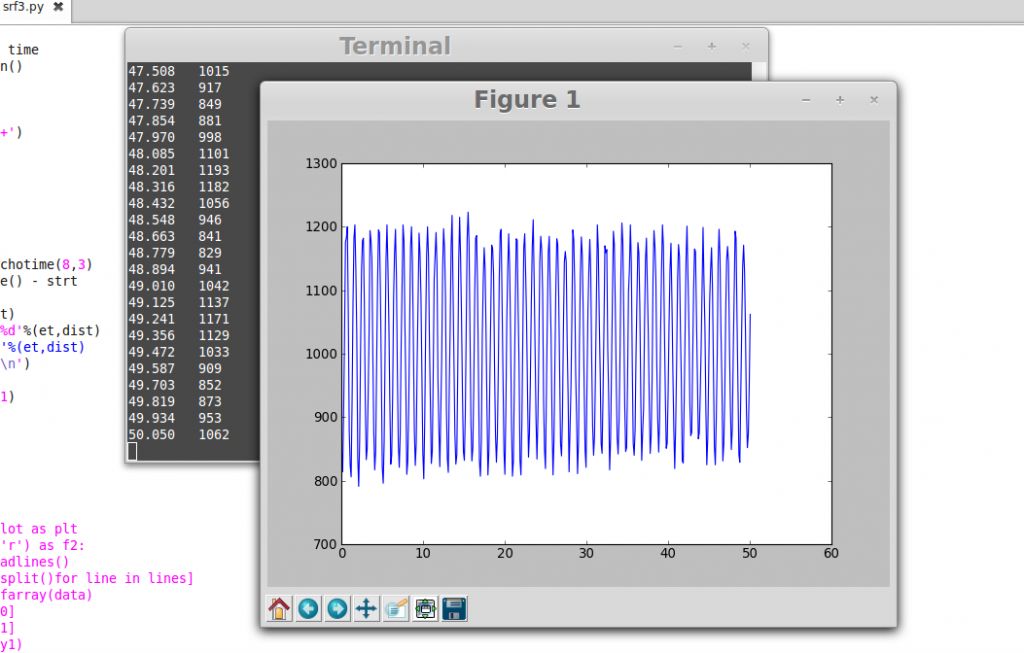
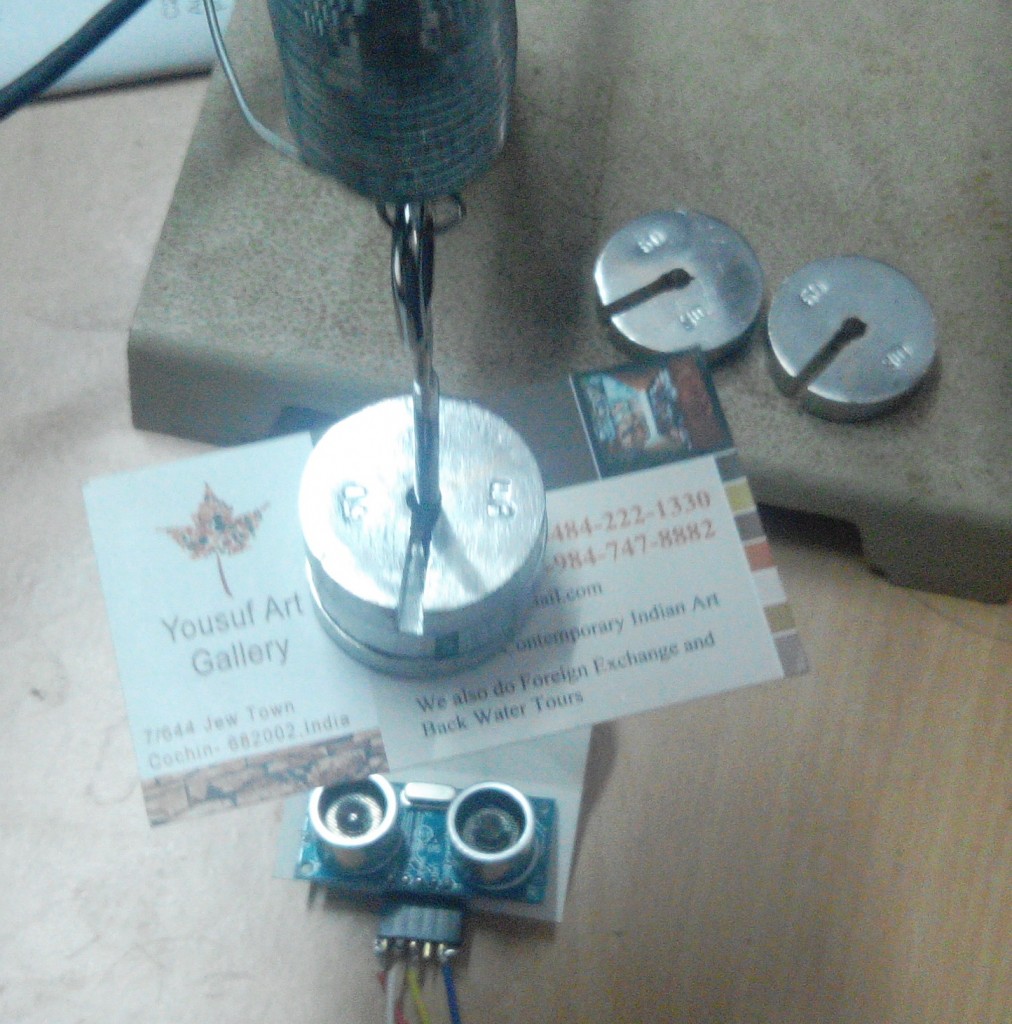
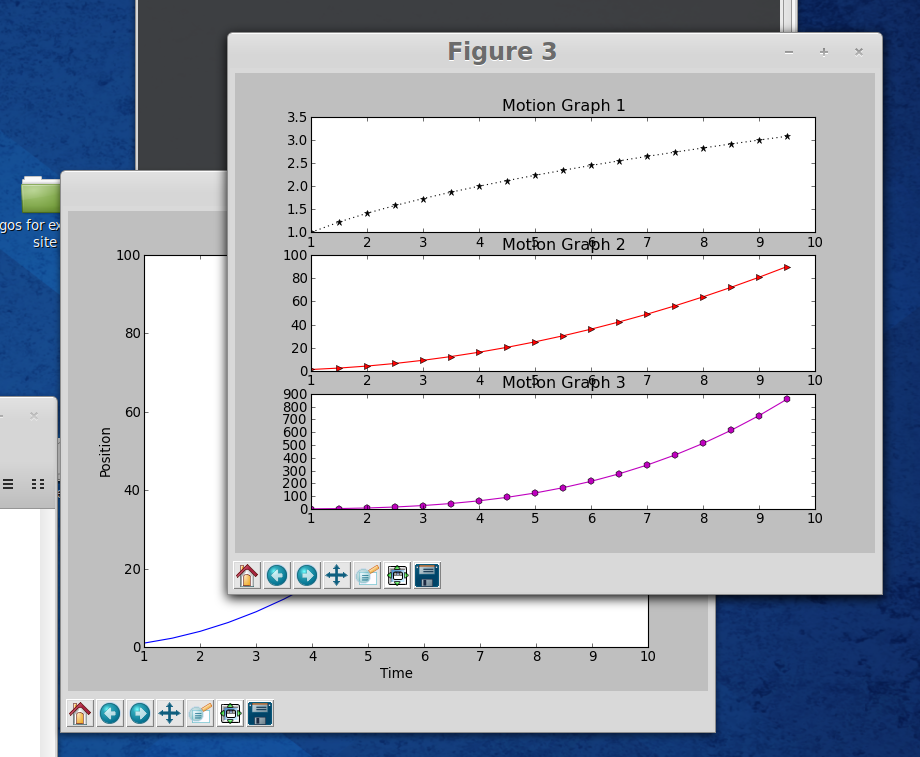
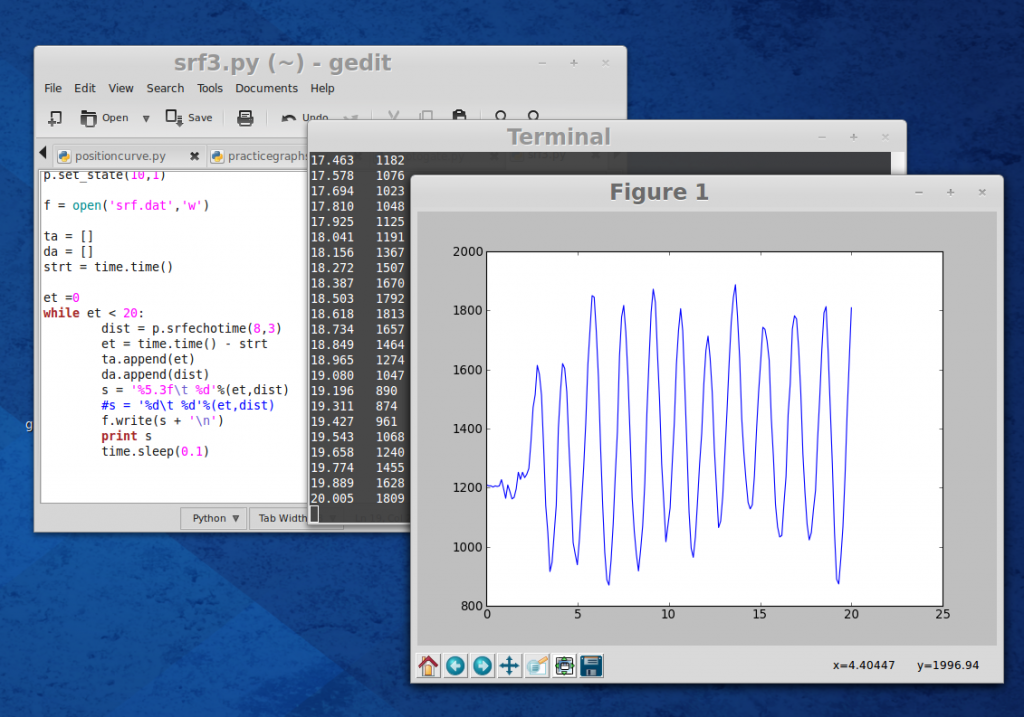
- GUI for using Motion sensor SRF-05, (ultrasonic position sensor) is modified for plotting real-time position.
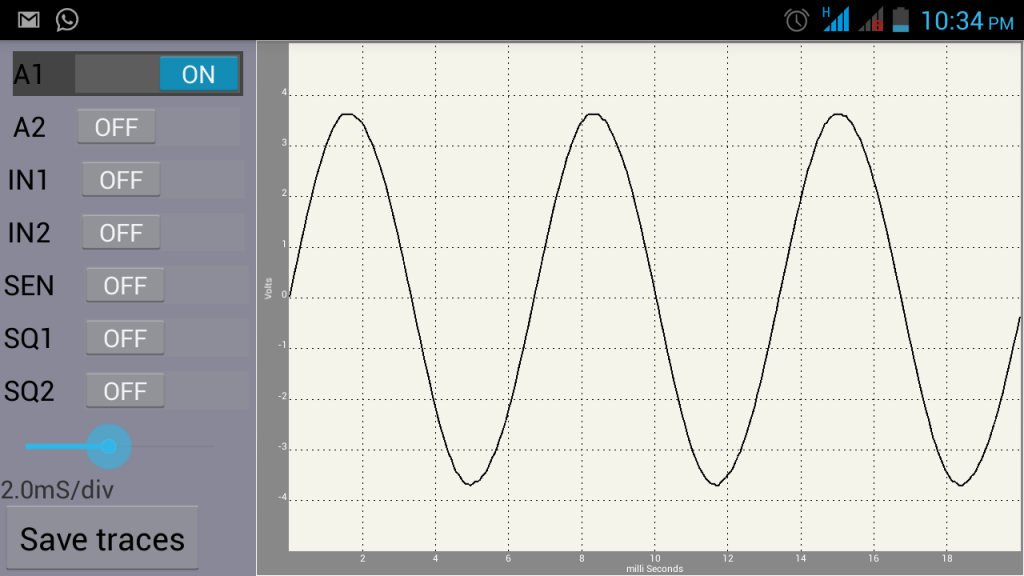
- Made necessary changes in GUI for Lissajous Figures using ATTINY85.
- Added Python-3 compatibility to all ExpEYES programs developed for GSoC-2014 Project

Ultrasonic Position Sensor SRF-05

ATTINY -85 MCU for Lissajous Figures
[wmd-toggle tab_background=”#75a5ce” tab_color=”#fff” content_background=”#93e9ea” content_color=”#725d53″ border_radius=”4″ ls-id=”55d9e004910b3″][wmd-toggle-tab title=”Voltammetric Measurements for Research in Nanotechnology”]Voltammetry%20experiments%20investigate%20the%20half%20cell%20reactivity%20of%20an%20analyte.%20Voltammetry%20is%20the%20study%20of%20current%20as%20a%20function%20of%20applied%20potential.%20These%20curves%20I%20%3D%20f%28E%29%20are%20called%20voltammograms.%20[/wmd-toggle-tab][/wmd-toggle]
My colleague Dr. (Mrs) Smita Kalagi is doing research on nano-materials and needed equipment for voltammetric measurements. I tried writing a python program for plotting voltammogram using ExpEYES and could carry trial measurements successfully. This development has resulted in a low cost, open source quality research equipment… 🙂
Voltammetry is analytical method used in chemistry and various industrial processes. In voltammetry information about an analyte is obtained by measuring the current as the potential is varied.
Will update with the actual set-up in the laboratory and experimental results soon…:)
[wmd-toggle tab_background=”#75a5ce” tab_color=”#fff” content_background=”#93e9ea” content_color=”#725d53″ border_radius=”4″ ls-id=”55d9e5010364a”][wmd-toggle-tab title=”Internationalization: French Localization”]GNU%20%60gettext%5C%27%20is%20an%20important%20step%20for%20the%20GNU%20Translation%20Project%2C%20as%20it%20is%20an%20asset%20on%20which%20we%20may%20build%20many%20other%20steps.%20This%20package%20offers%20to%20programmers%2C%20translators%2C%20and%20even%20users%2C%20a%20well%20integrated%20set%20of%20tools%20and%20documentation.%20Specifically%2C%20the%20GNU%20%60gettext%5C%27%20utilities%20are%20a%20set%20of%20tools%20that%20provides%20a%20framework%20to%20help%20other%20GNU%20packages%20produce%20multi-lingual%20messages.%0D%0A%0D%0ARef%3A%20http%3A%2F%2Fwww.gnu.org%2Fsoftware%2Fgettext%2F[/wmd-toggle-tab][/wmd-toggle]
This indeed is a good news for Pocket Science Lab Project. I have been adding support for internationalization based on Gettext, in all the python programs being developed for pocket science lab. This work was originally done for ExpEYES by Mr Georges from France. Now he has added French localization to Pslab… as a result all the GUI’s will be available in french … 🙂
[wmd-toggle tab_background=”#75a5ce” tab_color=”#fff” content_background=”#93e9ea” content_color=”#725d53″ border_radius=”4″ ls-id=”55d9e8544e8fb”][wmd-toggle-tab title=”Piezoelectric Transducer”]A%20piezoelectric%20sensor%20is%20a%20device%20that%20uses%20the%20piezoelectric%20effect%2C%20to%20measure%20changes%20in%20pressure%2C%20acceleration%2C%20temperature%2C%20strain%2C%20or%20force%20by%20converting%20them%20to%20an%20electrical%20charge.%20The%20prefix%20piezo-%20is%20Greek%20for%20%5C%27press%5C%27%20or%20%5C%27squeeze%5C%27.[/wmd-toggle-tab][/wmd-toggle]

Piezoelectric Transducers
Cheap piezoceramic membrane used in piezoelectric ‘buzzers’ can be used as a very inexpensive, accurate and sensitive pressure sensor. These devices can be used both as sensors and actuators, so they’re referred to as transducers, a term applied to any device that can convert one form of energy to another. The sensor turns mechanical energy into electric potential, and the actuator converts electrical energy into mechanical force or motion.
The Piezoelectric material used here, ceramic lead zirconate titanate known as PZT has the ability to provide twice the voltage of Quartz under a given force. These transducers are simple, reliable, and very robust, and so find wide use in industry, medicine, and aero-space work. They’re unaffected by external electromagnetic fields, and so can be used in applications where electronic sensors would fail. They are stable over a broad range of temperatures, but may be effected by long use at high temperatures.
The GUI program for Piezoelectric Transducer as force/impact sensor is
here…

GUI for using Piezo Sensor as Force/Impact Sensor
[wmd-toggle tab_background=”#75a5ce” tab_color=”#fff” content_background=”#93e9ea” content_color=”#725d53″ border_radius=”4″ ls-id=”55d9e5a6ad355″][wmd-toggle-tab title=”Some Other Sensor Plug-ins and Open Source Devices”/][/wmd-toggle]
IR Object Sensor
Made a simple Infra-red object sensor using IC LM358 (got a ready-made circuit board from local market). Wrote a GUI program for IR sensor and tested it. Added a potentiometer to the circuit. It can be used to modify sensitivity or range of the sensor.

IRobject-sensor
Barometric Pressure Sensor BMP 180
 Tested BMP180 Digital Barometric Pressure Sensor Board Module :This precision sensor from Bosch is the best low-cost sensing solution for measuring barometric pressure and temperature. ( Need to re-write the program to read data accurately) (Work in Progress)
I could interface BMP-180 with
MicroHope but facing some issues with interfacing it with ExpEYES. The data obtained is not matching with standard module from our Geology Lab. I am searching alternate sensor/method to measure atmospheric pressure.
DC Motor as Rotatory Motion Sensor
Sensor Used: DC Motor and a pick-up coil

Photo Gate
Sensor Used: Photo Gate using Photo Diode15. 
The GUI program written during GSoC-14 project is modified for measuring periodic time in oscillatory motion and also to measure acceleration due to gravity.
Other devices used
Solar Cells
Induction coil
GY-271 module
condenser MicLight Sensor ( Work in progress)
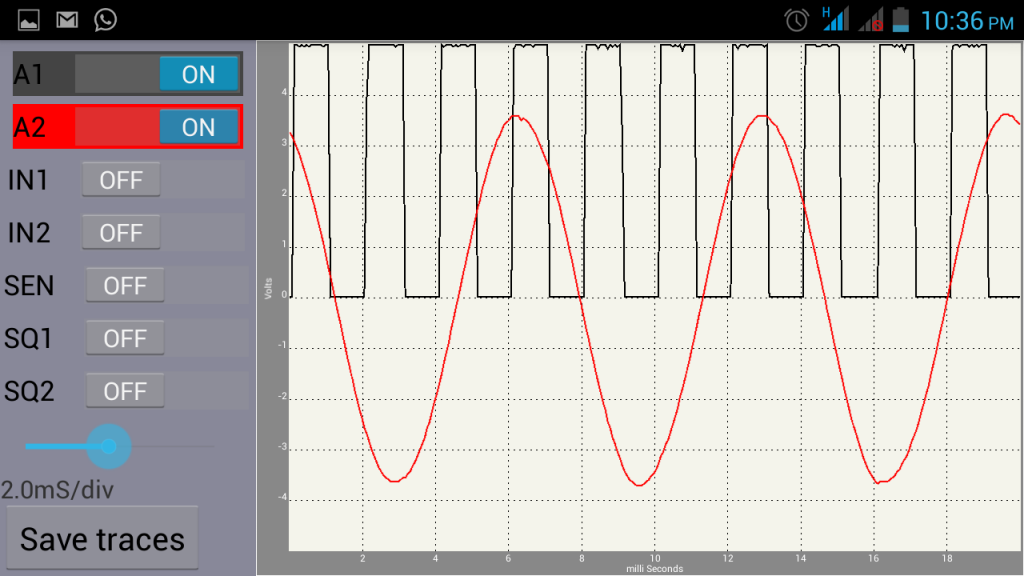
ATTINY-85 MCU used for sine wave generation
Raspberry Pi 2 Model B for stand-alone weather station
MicroHope : Micro-controller development system from ExpEYES Project


[wmd-toggle tab_background=”#75a5ce” tab_color=”#fff” content_background=”#93e9ea” content_color=”#725d53″ border_radius=”4″ ls-id=”55d9faac80004″][wmd-toggle-tab title=”After GSoC”/][/wmd-toggle]
Plan for next four months
- Calibration of sensor data
- Prototyping stand-alone weather station
- Pushing data to Loklak server
- Work on PSLab@Fossasia website
- Fossasia Live Cd based on Lubuntu with ExpEYES and other educational softwares
- Set-up Documentation for possible science experiments with the sensor plug-ins and low-cost, open source apparatus
[wmd-toggle tab_background=”#2e99ba” tab_color=”#fff” content_background=”#9adff4″ content_color=”#fff” border_radius=”4″ ls-id=”55da126f61694″][wmd-toggle-tab title=”My Git Hub Profile”]%3Cp%20style%3D%22text-align%3A%20center%3B%22%3E%3Ca%20href%3D%22https%3A%2F%2Fgnovi.edublogs.org%2Ffiles%2F2015%2F08%2Fgithubprofile-1n1wjhf.jpg%22%3E%3Cimg%20class%3D%22alignnone%20size-large%20wp-image-600%22%20src%3D%22https%3A%2F%2Fgnovi.edublogs.org%2Ffiles%2F2015%2F08%2Fgithubprofile-1n1wjhf-1024×718.jpg%22%20alt%3D%22githubprofile%22%20width%3D%22584%22%20height%3D%22409%22%20%2F%3E%3C%2Fa%3E%3C%2Fp%3E[/wmd-toggle-tab][/wmd-toggle]
[wmd-toggle tab_background=”#2e99ba” tab_color=”#fff” content_background=”#9adff4″ content_color=”#fff” border_radius=”4″ ls-id=”55da144842b99″][wmd-toggle-tab title=”Click on the coloured boxes to toggle open the content”]…..%0D%0A……….%0D%0A…………..[/wmd-toggle-tab][/wmd-toggle]