Sunday, 29th June 2014

Since yesterday I am working on setting up of an experiment to study Doppler effect in sound.

If the source of sound or the detector is in motion relative to the medium of propagation, the frequency of the waves that are emitted  appears to be changed due to Doppler Effect. This is an interesting experiment at Higher Secondary level.

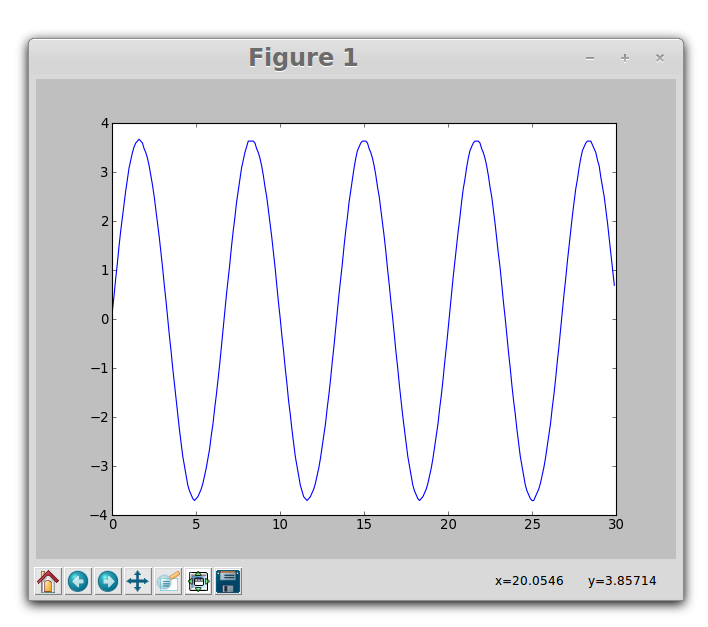
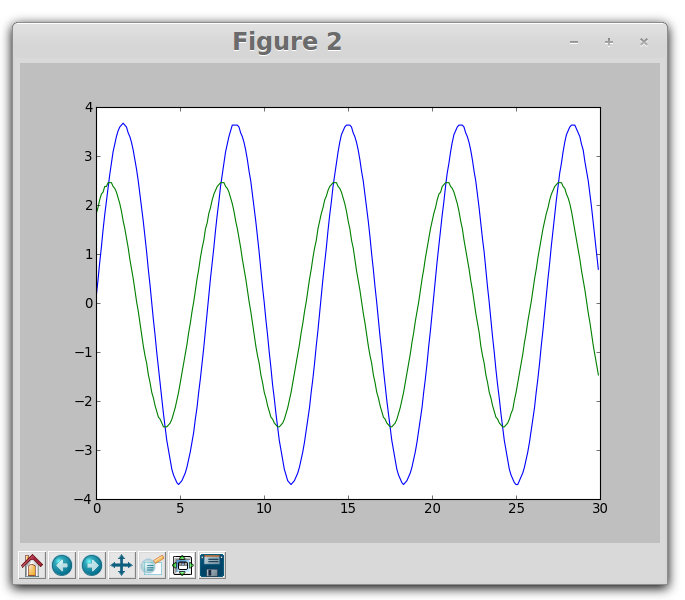
The experimental set-up is ready. I have used the linear air track and fixed the source of sound on the glider. the emitted sound waves can be detected by a microphone fixed in ExpEYES. We can determine the original frequency of the source using ExpEYES and then the source is set in to motion and again frequency is determined.  A photo-gate is used to measure the speed of the source.

The apparent frequency is related to the speed and the original frequency. The experimental results can be verified by theoretical calculations.

Practical Application:

  1. General Study of Doppler Effect
  2. For different frequencies, measure the Doppler shift with different velocities of the sound emitter. Compare the theoretical and experimental results.


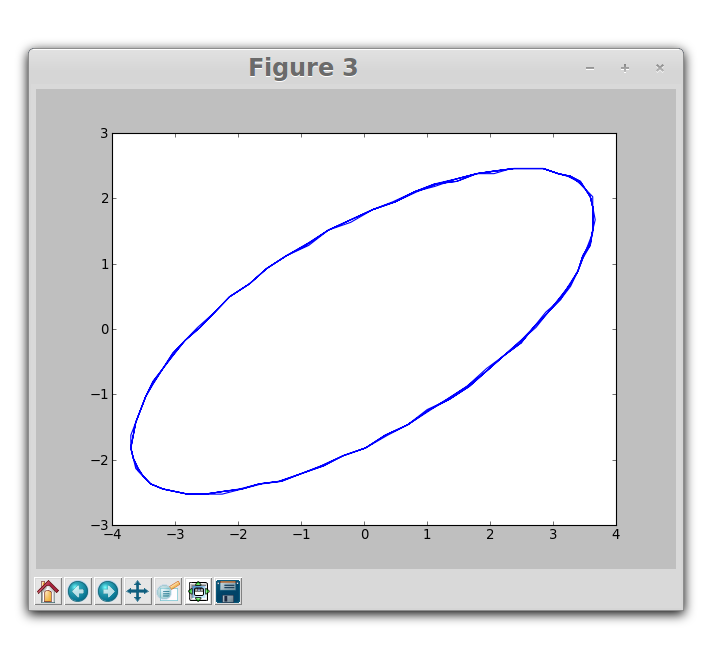
The python code required for measuring frequency and also to determine speed using photo-gate  is already written. I could get good results in my experimental trials.

Tomorrow I will work on developing a separate code for a simple GUI for this experiment.

Saturday, 28th June 2014

Today I started working on an interesting experiment in sound and Waves. It is very  difficult to do experiments involving Doppler Effect in conventional laboratory. But with the help of ExpEYES Doppler Effect can be Demonstrated very easily.

The experimental set-up for demonstration of Doppler effect is ready. We need a moving source relative to the detector. Detector is the simple mic inside ExpEYES. For getting  a source which is harmonically oscillating, I used A buzzer attached to a spiral spring and made it oscillate in-front of the mic.

First, the frequency of the emitted signal is measured at rest. Then, the frequency shift that is caused by the oscillating source is measured. this can easily demonstrate ‘the apparent change in the frequency due to Doppler Effect.

My next step is to develop a set-up to measure Doppler Shift in case of a moving source with constant velocity. For this I am planning to use my linear air track which is developed for mechanics experiments, so that the cost can be reduced.


Saturday, 21st June 2014

Today worked on an experiment to produce Lissajous figures using two square waves. Wrote Program in python and tested the same. Could obtain various Lissajous patterns.

In the code we used Capture2 function from ExpEYES library to plot the figures. Here is the example…

_________________________________________________________________________

from pylab import *
import expeyes.eyesj
p = expeyes.eyesj.open()
from pylab import *
t1,v1,t2,v2 = p.capture2(1, 2, 300, 100)
figure(1)
plot(t1,v1)
figure(2)
plot(t1,v1, t2,v2)
figure(3)
plot(v1,v2)
show()

__________________________________________________________________________

figure 1 is a sine wave connected to channel A1

sine

figure2 shows the phase different introduced using a 1 microfarad capacitor and 1kilo ohm resistor.

lisawaves

this is the resulting Lissajous pattern…..

lissaellipse

Need to create a GUI where user can change the phase between the two waves and can obtain different patterns.

Tomorrow I will be working on the same experiment to produce different patterns.

 Following is the related information

Source :

  1. http://www.britannica.com/EBchecked/topic/343305/Lissajous-figure
  2. http://en.wikipedia.org/wiki/Lissajous_curve

Lissajous figure, also called Bowditch Curve, pattern produced by the intersection of two sinusoidal curves the axes of which are at right angles to each other.

If the frequency and phase angle of the two curves are identical, the resultant is a straight line lying at 45° (and 225°) to the coordinate axes. If one of the curves is 180° out of phase with respect to the other, another straight line is produced lying 90° away from the line produced where the curves are in phase (i.e., at 135° and 315°).

Otherwise, with identical amplitude and frequency but a varying phase relation, ellipses are formed with varying angular positions, except that a phase difference of 90° (or 270°) produces a circle around the origin. If the curves are out of phase and differing in frequency, intricate meshing figures are formed.

The appearance of the figure is highly sensitive to the ratio a/b. For a ratio of 1, the figure is an ellipse, with special cases including circles (A = B, δ = π/2 radians) and lines (δ = 0). Another simple Lissajous figure is the parabola (a/b = 2, δ = π/4). Other ratios produce more complicated curves, which are closed only if a/b is rational. The visual form of these curves is often suggestive of a three-dimensional knot, and indeed many kinds of knots, including those known as Lissajous knots, project to the plane as Lissajous figures. (REF: http://en.wikipedia.org/wiki/Lissajous_curve)

  • a = 1, b = 2 (1:2)
  • a = 3, b = 2 (3:2)
  • a = 3, b = 4 (3:4)
  • a = 5, b = 4 (5:4)

GSoC Weekly Report 3

Third week of coding was very much productive.

We could plot position -time and velocity-time graphs using  the time and position data obtained from SRF 05 Sensor. I just moved  a notebook in-front of the sensor, up and down  and could plot position against time . But the plots were little noisy and giving unusable estimates of  the acceleration.

Therefore  I had to spend time to understand some filtering techniques. Google Search led me to the Kalman filter which is is a mathematical method that uses noisy measurements observed over time to produce values that tend to be closer to the true values of the measurements and their associated calculated values. With the inputs from my colleagues at FOSSASIA I could gather some good information about filtering techniques.

Experiment with Spring oscillations is also set up and could generate plots. GUI needs to be created for this experiment.

For experiments with Sound related phenomena we used two microHope boards to convert square wave into a sine wave. Wrote programs for two sound experiments. For reference, Used programs written by Dr. Ajith Kumar, the inventor of ExpEYES.

Tried the experiments with square waves SQR1 and SQR2 from ExpEyes kit. We are also working on preparing a stand alone board which can give variable frequency sine waves. This will be useful in  experiments like interference of sound, phenomena of beats and Lissajous figures.Uploaded these programs to Git repo.

This weeks work in points

  • Written python Codes for following mechanics experiments
  1. Study of One dimensional motion by plotting Position Time Graph
  2. Study of phase relation in graphs using two sensors.
  3. Plotting velocity-time and acceleration-time graph.
  • Code to use Two sensors simultaneously is ready to be tested tested. Used SQR1 and IN1 channels for accessing the second sensor.
  • Experimental set up to determine Spring Constant by method of oscillations is ready. Tested the code.
  • Set up for producing sine waves from square waves is ready. Using two MicroHope kits. We are working on a stand alone kit which can produce two variable sine waves.
  • Tried some filtering techniques for plotting smooth acceleration graphs.

To Do Next Week

  • Set up experiments involving collisions
  • Set-up experiment to determine acceleration due to gravity by motion on incline.
  • Write code for using photo-gates for determination of speed and acceleration.
  • Write code for plotting multiple graphs on a screen.
  • Main Focus Next week will be on completing documents on experimental procedures and uploading them on Gtt.

https://github.com/wavicles/Plugins-for-ExpEYES