GSoC Weekly Report 13

(From Monday 11th August to 17th August 2014)

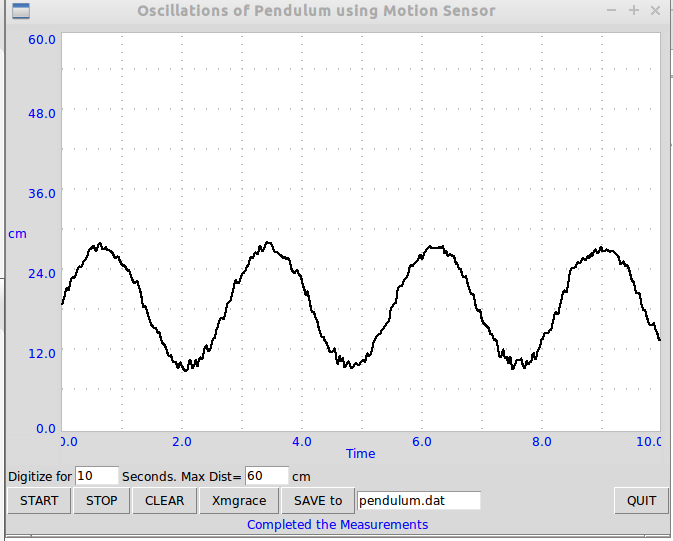
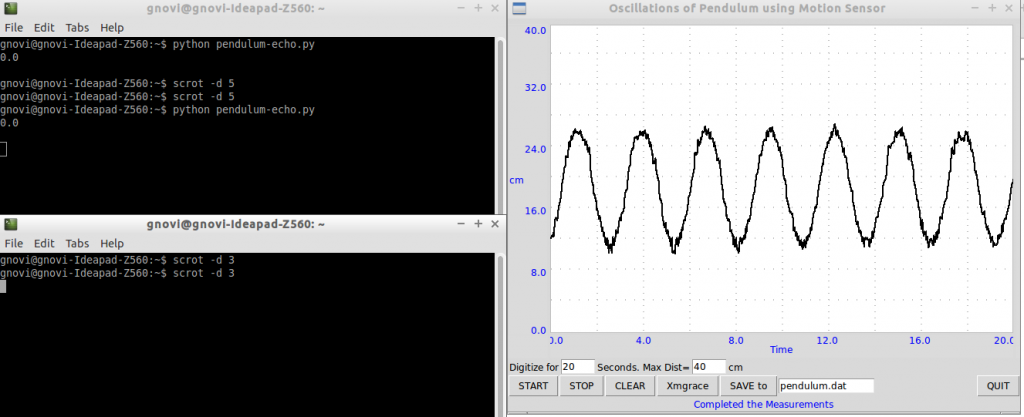
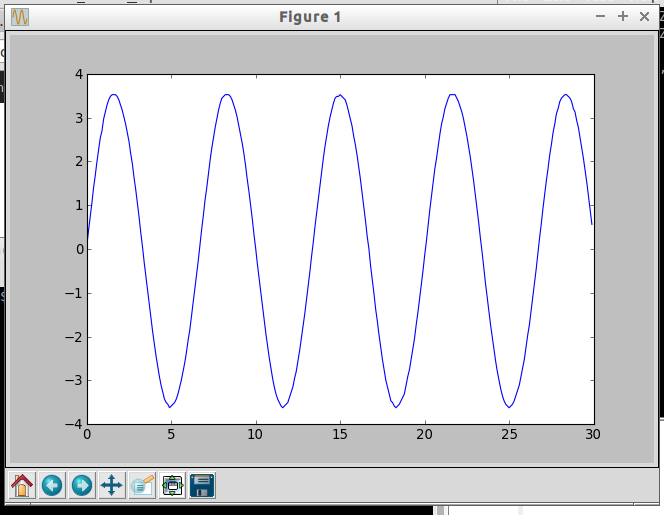
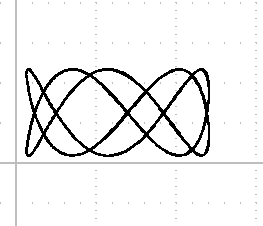
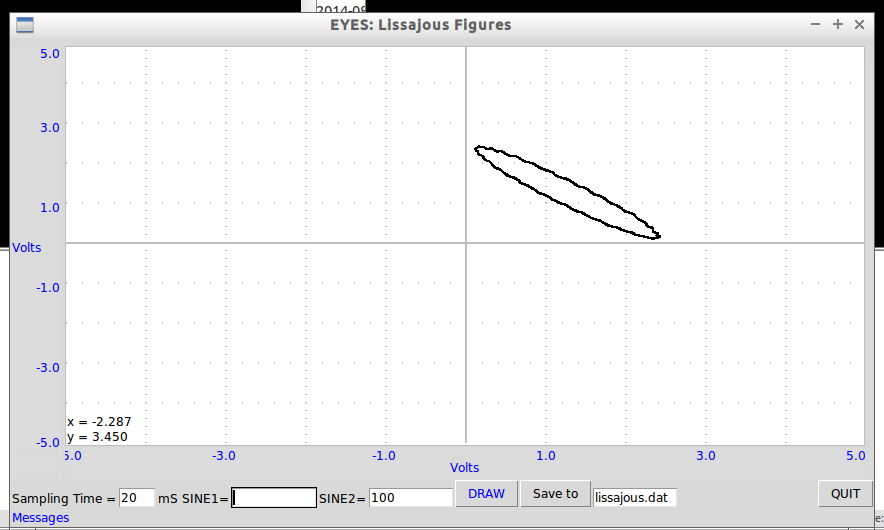
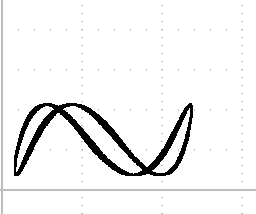
This week I conducted experimental trials for all the experiments using python code written for Real-Time plotting and also code for Off-Line mode. Did modifications in the programs wherever necessary and finalized the code for experiments. Wrote python code for Mechanics and Sound GUI. Worked on documents.

I am also working on packaging everything so that the plug-ins can be separately installed on a machine where ExpEYES is pre-installed. Need few days for this work. I will continue this after the final evaluation report is submitted.

To Do Next Week……

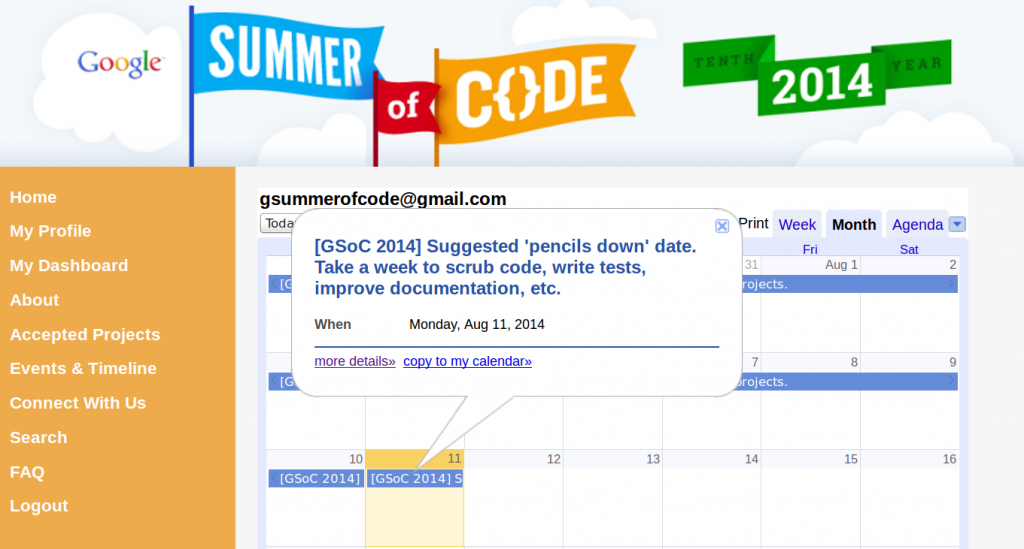
  • Submission of Final Evaluation
  • Complete and upload Experiments documents to the blog site.
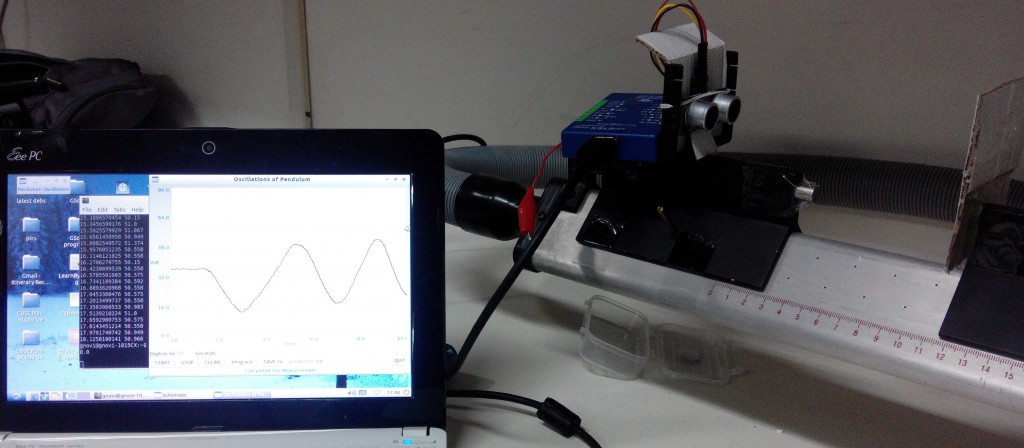
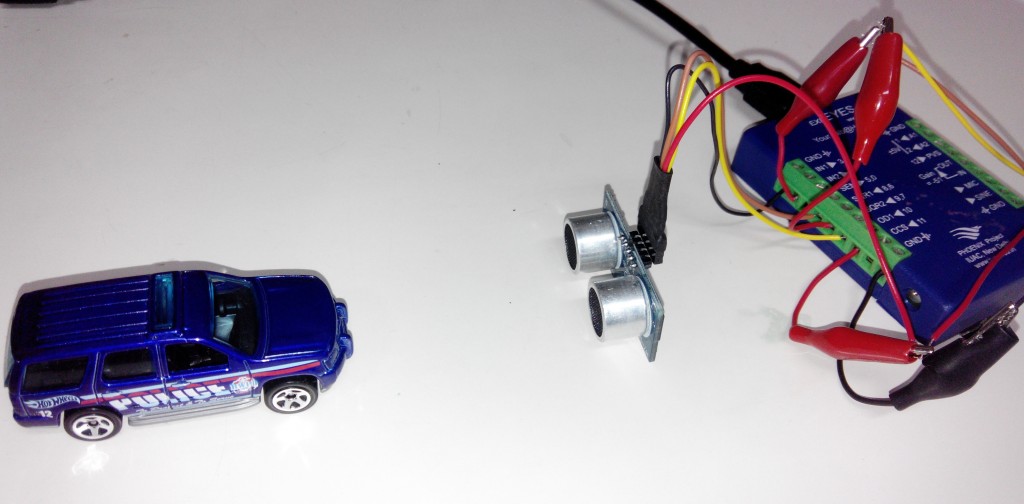
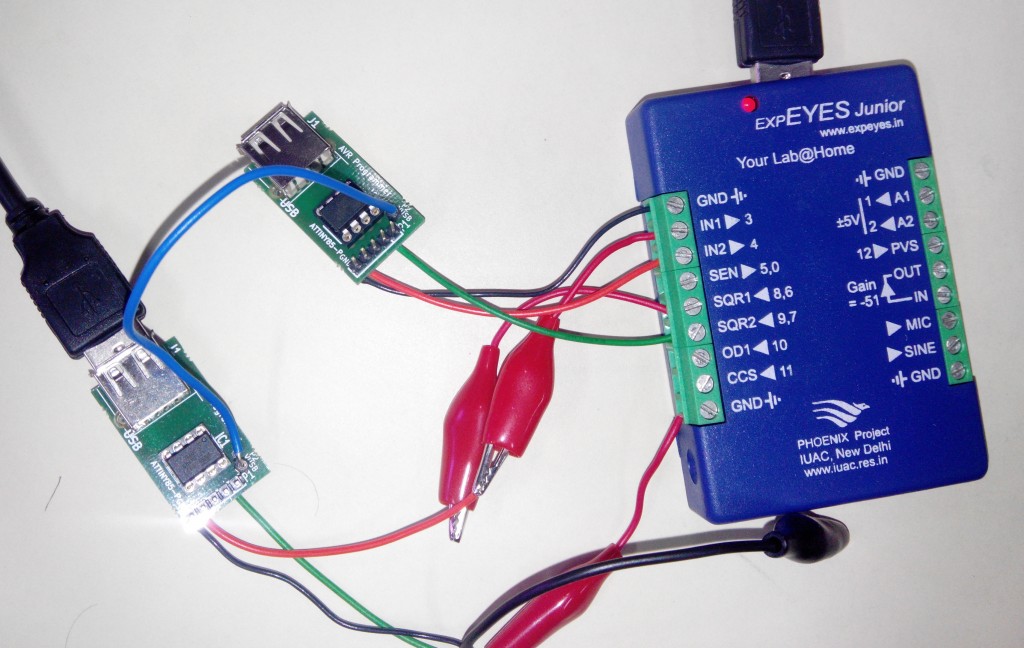
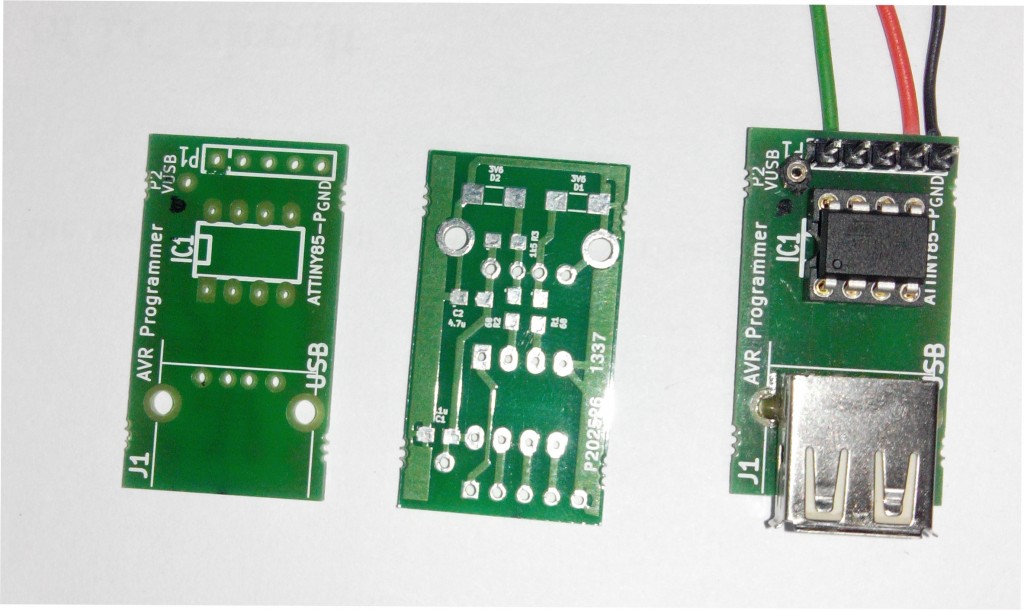
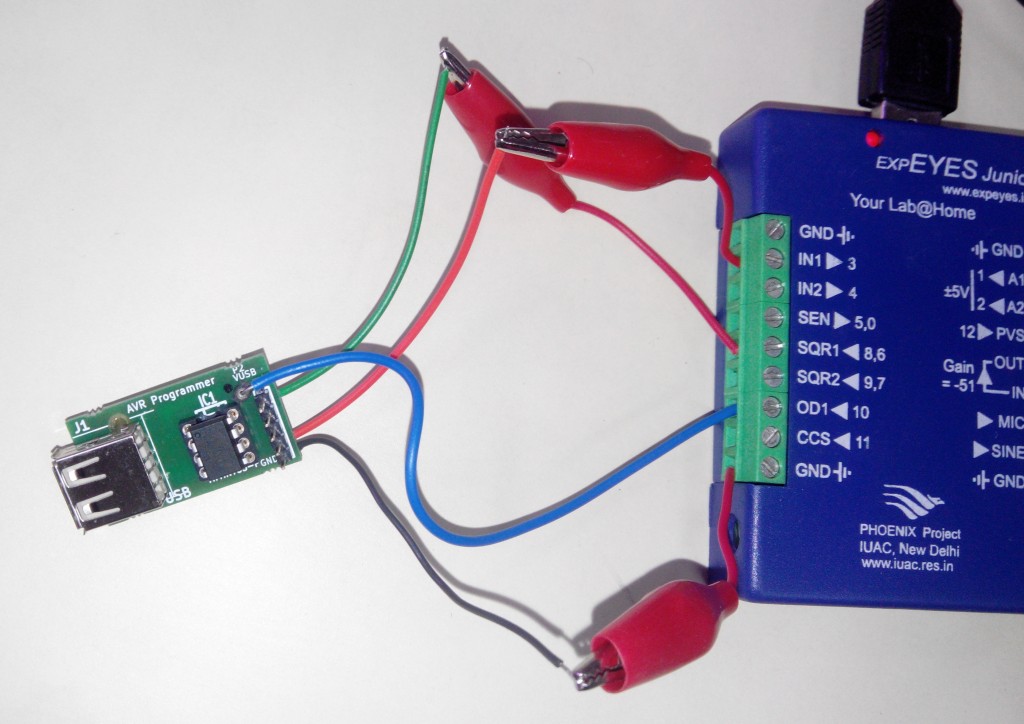
  • Take trials with experimental set-up and upload photographs and videos.
  • Create a package that can be installed on a machine where ExpEYES is pre-installed.

Since most of the apparatus for all experiments is home-made, I will be uploading the procedure with photographs for creating these devices. I will also add documents with relevant theory for each of the experiment  to the blog site.

It had been a great journey with new learning experiences. Thanks a million to my mentors Mario Behling, Hong Phuc Dang & Hau Dang at FOSSASIA  and Ajith Sir. Even though the coding season ends tomorrow, I am feeling like its a beginning for me.

There is a lot to be done…. and I will be continuing with the work to make this dream a reality.. a dream of providing every student with the most affordable pocket science laboratory.

I have thought of many new experiments on  which I will be working for next couple of days. Also thinking of having a separate website for this work…its possible now…thanks to funding from Google.


Saturday, 16th August 2014

Today since morning I am on Python code for Sound and waves GUI. Its almost ready… 🙂

Tried various experiments with the new python programs written for plotting real-time graphs to test for errors and did necessary corrections. Also gave finishing touch to programs and added to Git repo. Work of writing documents for experimental procedures is taking positive shape.  After the finishing the required coding part I will focus more on the documentation part.

Monday 18th August is the firm ‘pencils down’ date. Therefor I am working on the programs to give them the final form.


Friday, 15th August 2014

Continued working on python codes for various experiments….. Conducted trials with python code for plotting real-time graphs.

Did various experiments on linear air track to study concepts like momentum, collision, motion on incline etc.


airtrack

Used toy cars for motion experiments. this will be a low cost solution for experiments in mechanics where air track is not available…:)


car

In an experiment with pendulum using motion sensor we could get the desired result. Now pendulum experiments can be done using three different sensors

  • light sensor – Photo-gate
  • motion sensor – srf05 ultrasonic module
  • DC motor

These are screen shots of motion of pendulum with srf05 module

pend pend2

Thursday, 14th August 2014

Work on sound experiments….giving finishing touch.

The sine wave generator devised using ATTINY85 mcu by Ajith Sir is really very helpful in conducting sound experiments.

We could get a fine sine wave using ATTINY module


sin

Two ATTINY modules are working perfectly for producing lissajous figures.

attinylissa

lis3

Tuesday, 12th August 2014

Today I could complete documentation of experiments with linear air track. Also gave finishing touch to python codes by adding gettext module for internationalization.

The gettext module provides internationalization (I18N) and localization (L10N) services for your Python modules and applications. It supports both the GNU gettext message catalog API and a higher level, class-based API that may be more appropriate for Python files. It allows you to write your module and application messages in one natural language, and provide a catalog of translated messages for running under different natural languages.

Thanks to Georges Khaznadar who helped us with internationalization. The following code is added to all the programs.

”’

import gettext
gettext.bindtextdomain(“expeyes”)
gettext.textdomain(‘expeyes’)
_ = gettext.gettext

”’

Now need to work on pages for individual experiments and also the Common GUI for sound and mechanics.


Monday, 11th August 2014

pencil down1

Today is the [GSoC 2014] Suggested ‘pencils down’ date, therefore this week I will be working on scrubbing the   code, improving  documentation and completing integrated GUIs for mechanics and sound experiments. I will also complete separate pages for all the experiments on the blog.

The Firm ‘pencils down’ date is ob 18th August 2014. therefore before Sunday 17th August I will try and give finishing touch to everything.

Worked on some python programs and changes committed to Github. Tried experiments on linear air track with new code developed for plotting real-time graphs. things have become amazingly simple and many concepts in mechanics can be easily demonstrated with our set-up.

GSoC Weekly Report 12

(From Monday 4th August to 10th August 2014)

This week we could complete the planned work  of writing python programs for plotting real-time graphs and Experimental set-up and code for sound Experiments.

The days spent at  IUAC   (Inter University Accelerator Centre) , New Delhi, ( from 7th August to 10th August) were really fruitful in accelerating the project work.  Dr. Ajith Kumar (who is the man behind  Phoenix Project and inventor of  ExpEYES)  helped me to get permission to work in Teaching Lab and also arranged for my accommodation in IUAC Guest House. Ajit Sir helped me a lot with my project work in writing python programs to plot graphs in real-time.

He has also designed a tiny sine wave generator using ATTINY85 micro-controller which  is of great use in performing sound and waves experiments. We spent a lot of time in the laboratory to give finishing touch to all the programs developed so far.  Jithin B P , IISER Mohali, (jithinbp at gmail.com), who is working on developing android app for all ExpEYES programs was also there with us.

Things we could do ……

  • Completed Coupled Pendulum Experiment with all the theoretical details
  • Experiment to obtain Chladni figures is complete with the experimental set up and also the python code access the experiment.
  • We got the air-track set-up for doing the mechanics experiments. Repeated some of the motion related  experiments to study the changes required. We modified the program for using srf module to plot position time graph. Now we can fetch the position-time data and store it in a file and then plot the p-t, v-t and a-t graphs. We wrote another program to plot this graph in real -time. This program enables students to see the graph in real time as the glider moves on the air track.
  • We also set-up a pendulum experiment using a thick metal block and suspended it using  long strings to have a pendulum of large time period. The program is written to plot the position of pendulum using motion sensor. Committed the same to Git repository. The plot shows the smooth sine curve of oscillations.
  • Tried the experiment with motion sensor using toy cars. this can be an amazing demonstration experiment for highschool students.

Modified and finalized the following python programs…

  • pendulum-echo.py : Program to study oscillations of a pendulum using ultrasonic sensor sfr05 (position detector) by plotting real-time graph
  • coupled-pend-real-time.py : Program to plot oscillations of TWO coupled pendulums in real-time
  • motion-airtrack-echo.py : Programe to plot position time graph for vehicles moving on linear air-track
  • motion-compare-airtrack-echo.py : This program allows to plot position-time graph af motion of a vehicle on an air track.
    One can take multiple trials and view all the plots. this can be used to compare different aspects of motion
    like velocity, acceleration etc…
  • motion-two-srfecho.py : This program allows user to use TWO motion sensors (srf-05 modules) and plot both the graphs
    in real-time. This can be used for studying collisions, conservation of momentum etc…on air track or also frictionless track.
  • We did  necessary modifications in  ATTINY85 based board which can take square wave as input and generates sine wave.
  • Did the experiment to obtain Lissajous figures using two ATTINY boards and wrote the python code to plot the graphs.
  • Also wrote a code for GUI for sound and waves experiments.

To Do Next Week……

Since tomorrow is the [GSoC 2014] Suggested ‘pencils down’ date, therefore coming week I will be working on scrubbing the   code, improving  documentation and completing integrated GUIs for mechanics and sound experiments.

The Firm ‘pencils down’ date is ob 18th August 2014. therefore before Sunday 17th August I will try and give finishing touch to everything.


Saturday, 9th August 2014

Let’s generate some signals!

Here is our tiny sine wave generator for sound and waves experiments.

attiny1

The ATTINY85 based board which can take square wave as input and generates sine wave. In the picture- board and the completed module.

ATTINY 85 is the high-performance, low-power Atmel 8-bit AVR RISC-based microcontroller combines 8KB ISP flash memory, 512B EEPROM, 512-Byte SRAM, 6 general purpose I/O lines, 32 general purpose working registers, one 8-bit timer/counter with compare modes, one 8-bit high speed timer/counter, USI, internal and external Interrupts, 4-channel 10-bit A/D converter, programmable watchdog timer with internal oscillator, three software selectable power saving modes, and debugWIRE for on-chip debugging. The device achieves a throughput of 20 MIPS at 20 MHz and operates between 2.7-5.5 volts.

The ATTiny85! In the DIP configuration,  is about 9mm x 9mm, can be programmed using the Arduino IDE, runs on as low as 3.3V at pretty tiny amperages. Here is the pin configuration…

We programed it using USBASP programmer from our microhope project.

mh-usbasp

After programing the chip, now we can use it with ExpEYES as a sine wave generator. The connections are made like this….

attiny-connections

pin1 is RESET pin2 is input where SQR can be connected and pin 3 is the output. The module can be powered usent external USB or with OD1 as shown in the pic.

To reset pin 1 (marked as P1) should be connected to GND for a fraction of second. This is useful to obtain lissajous figures for which two modules can be used. Both the modules can be powered with single USB.

attinylissa

We also wrote a program in python for lissajous figures.

Here is the amazing result…..

lis2 lis1lis3

I also worked on few python programs to finalize them. Now almost all the programs are ready.

Here is my today’s activity on Github

Friday, 8th August 2014

Joy of doing….experimenting n exploring……

It’s awesome to work here at IUAC ( Inter University Accelerator Centre) New Delhi.

Labs are open 27X7…. all the facilities are accessible….. Have a new idea? ….work on it ….. develope ….design… get it fabricated in the workshop….test it in the laboraty….. modify…redesign….assemble …and you are done!!! Its awesome to see something virtual from your thoughts ….to a real thing on your table….

Developing new low cost science experiments……… to put it in simple words…bringing the cost of quality lab apparatus from few Laks to few hundreds………

But that’s not the only thing……It all open source……FOSS is the best thing that has happened in couple of centuries…..
#ExpEYES #FOSSASIA   #GSoC

Today we did a lot of coding work. I had already written python program to plot fetch data using sensors through ExpEYES and then plot the graphs. We re-wrote some of these programs to obtain graphs in real time. And the results are amazing.

Modified and finalized the following python programs…

  • pendulum-echo.py : Program to study oscillations of a pendulum using ultrasonic sensor sfr05 (position detector) by plotting real-time graph
  • coupled-pend-real-time.py : Program to plot oscillations of TWO coupled pendulums in real-time
  • motion-airtrack-echo.py : Programe to plot position time graph for vehicles moving on linear air-track
  • motion-compare-airtrack-echo.py : This program allows to plot position-time graph af motion of a vehicle on an air track.
    One can take multiple trials and view all the plots. this can be used to compare different aspects of motion
    like velocity, acceleration etc…
  • motion-two-srfecho.py : This program allows user to use TWO motion sensors (srf-05 modules) and plot both the graphs
    in real-time. This can be used for studying collisions, conservation of momentum etc…on air track or also frictionless track.

Sill working on programs for sound experiments….. Hopefully tomorrow, it will be done…

Here is a link to my Github repo..today’s work