Thursday, 12th June 2014

Today tried to measure acceleration due to gravity using motion of glider on an inclined plane.

Used the pickup i designed yesterday and photo-gate to measure acceleration. The results are very good and are in close agreement with theoretical calculations.

For motion on an incline acceleration along the inclined plane is g’ = g sin(theta) where (theta) is the angle on inclination. wrote a small python code using time measurement functions of ExpEYES library.

Used this code for measuring time…

import expeyes.eyesj

p= expeyes.eyesj.open()

a = p.multi_r2rtime(3)  # time for 1 cycle

b = p.multi_r2rtime(3,2)  #time for  4 cycles, 2 rising edges are skipped

print a

print b


Wednesday, 11th June 2014

Had my exam today in the morning. I could do reasonably well……lets hope for good result.

After coming back from college at 5.00PM , started working on my project…..I am really enjoying time with GSoC. Thought of using some different method to determine acceleration due to gravity.

Used the same set up of linear track in inclined position at about 45 degrees. Allowed vehicle to glide downwards and plotted position-time graph. Got straight line with positive slope as expected. Then used photo-gate with expeyes kit and could make time measurements.

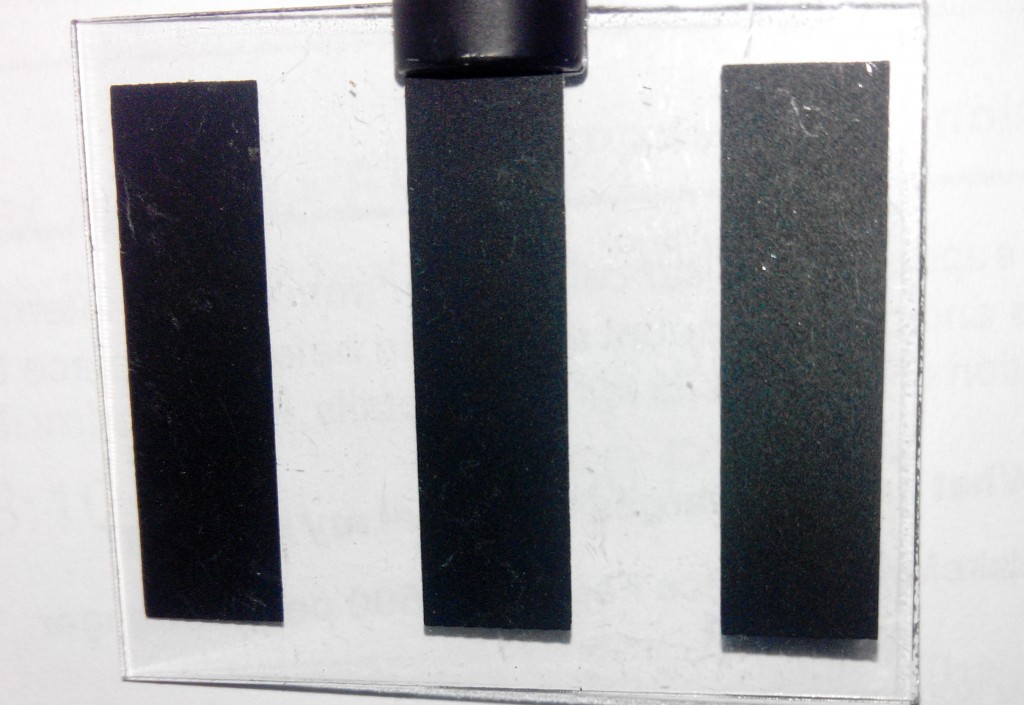
Got this pick-up ready ……pickup for acceleration
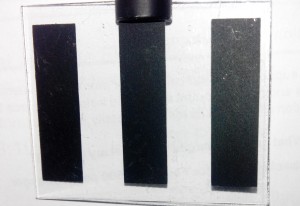
 

This can generate a square wave as it passes through photogate. Acceleration can be determined  using the signal generated. Excited to see its working.

But now I have a problem ….how to measure the acceleration from the wave pulse generated. I think I should find time between rising and falling edge  the wave-pulse. Will work on this tomorrow ……..Feeling Sleepy now…. 🙂

This is the photo-gate I have used ….(photo from www.expeyes.in)
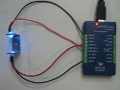
light-barrier Need to modify this as it is difficult to mount above linear track. will be going for design similar to photogate which I used with old version of ” Phoenix” box……..


Its here…
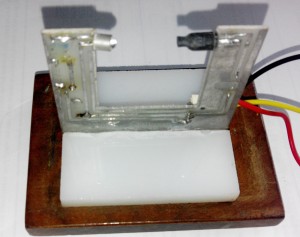
old photogate

………………………..


Any idea for easy measurement of acceleration using the pickup shown above?

Some proprietary closed source devices use this method……….( of course they come at a very high cost price)

Please share any modification in the pickup oar any idea for accurate measurement of acceleration using photo-gates….

This will result in a very low cost setup………thanks to FOSS…… 🙂

I love being a FOSSASIAN….. 🙂 🙂 🙂

 

Monday, 9th June 2014

Today the attempt to use two sensors at a time got little success. Used two srf05 modules to plot graphs. Both the graphs were out of phase as expected.

I will take a break of one day to prepare for my B.Ed. Exam which is on 11th June.

Will be back on 11th June evening with detailed experiment update.


GSoC Weekly Report 3

Third week of coding was very much productive.

We could plot position -time and velocity-time graphs using  the time and position data obtained from SRF 05 Sensor. I just moved  a notebook in-front of the sensor, up and down  and could plot position against time . But the plots were little noisy and giving unusable estimates of  the acceleration.

Therefore  I had to spend time to understand some filtering techniques. Google Search led me to the Kalman filter which is is a mathematical method that uses noisy measurements observed over time to produce values that tend to be closer to the true values of the measurements and their associated calculated values. With the inputs from my colleagues at FOSSASIA I could gather some good information about filtering techniques.

Experiment with Spring oscillations is also set up and could generate plots. GUI needs to be created for this experiment.

For experiments with Sound related phenomena we used two microHope boards to convert square wave into a sine wave. Wrote programs for two sound experiments. For reference, Used programs written by Dr. Ajith Kumar, the inventor of ExpEYES.

Tried the experiments with square waves SQR1 and SQR2 from ExpEyes kit. We are also working on preparing a stand alone board which can give variable frequency sine waves. This will be useful in  experiments like interference of sound, phenomena of beats and Lissajous figures.Uploaded these programs to Git repo.

This weeks work in points

  • Written python Codes for following mechanics experiments
  1. Study of One dimensional motion by plotting Position Time Graph
  2. Study of phase relation in graphs using two sensors.
  3. Plotting velocity-time and acceleration-time graph.
  • Code to use Two sensors simultaneously is ready to be tested tested. Used SQR1 and IN1 channels for accessing the second sensor.
  • Experimental set up to determine Spring Constant by method of oscillations is ready. Tested the code.
  • Set up for producing sine waves from square waves is ready. Using two MicroHope kits. We are working on a stand alone kit which can produce two variable sine waves.
  • Tried some filtering techniques for plotting smooth acceleration graphs.

To Do Next Week

  • Set up experiments involving collisions
  • Set-up experiment to determine acceleration due to gravity by motion on incline.
  • Write code for using photo-gates for determination of speed and acceleration.
  • Write code for plotting multiple graphs on a screen.
  • Main Focus Next week will be on completing documents on experimental procedures and uploading them on Gtt.

https://github.com/wavicles/Plugins-for-ExpEYES

Saturday, 7th June 2014

Today In the morning  wrote programs for two sound experiments.For reference, Used programs written by Dr. Ajith Kumar, the inventor of ExpEYES.

Tried the experiments with square waves SQR1 and SQR2 from ExpEyes kit. We are also working on preparing a stand alone board which can give variable frequency sine waves. This will be useful in  experiments like interference of sound, phenomena of beats and Lissajous figures.Uploaded these programs to Git repo.


Thrusday, 5th June 2014

Yesterday night I tried to plot graphs using  the time and position data obtained from SRF 05 sensor. I just moved  a notebook in-front of the sensor, up and down  and could plot position against time . But the plots were little noisy and giving unusable estimates of  the acceleration.

Today spent time to understand some filtering techniques.

Google Search led me to the Kalman filter which is is a mathematical method that uses noisy measurements observed over time to produce values that tend to be closer to the true values of the measurements and their associated calculated values.

I have downloaded some docs on filtering techniques and now I am studying them. I think I should take help from my mentors and fellow coders from FOSSASIA………

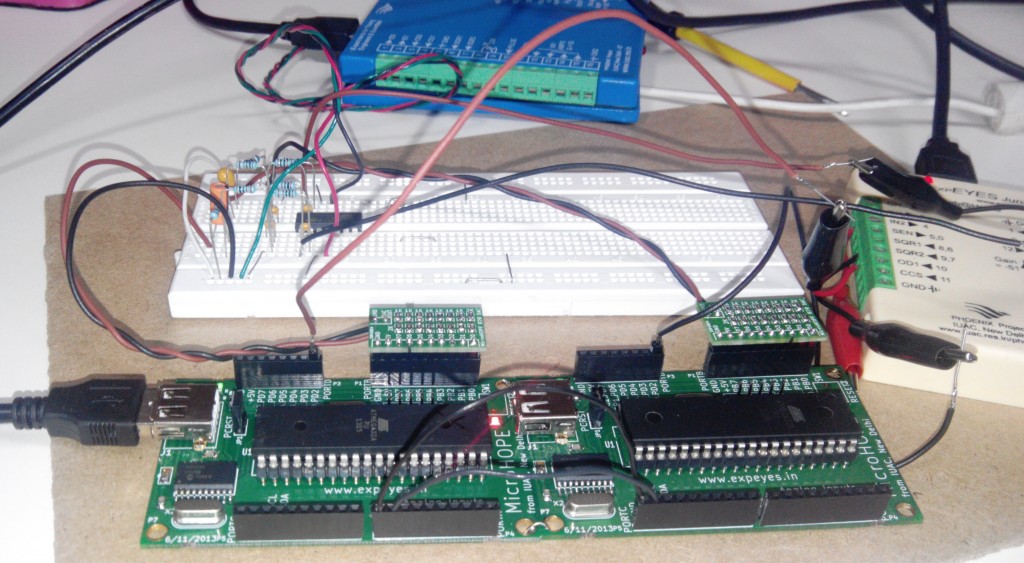
Before I go to sleep will try to finish   the setup to generate sine waves for sound experiments……..Its almost ready …..:)

generating sine wave for sound expt

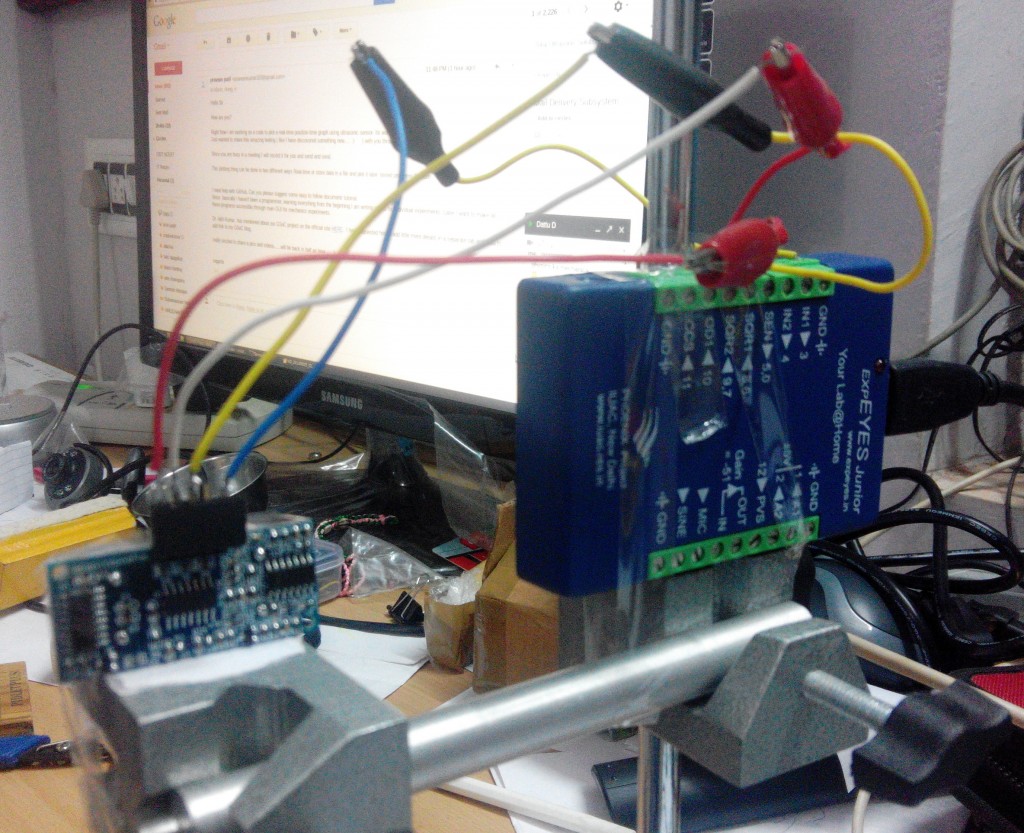
Used two microHope boards to convert square wave into a sine wave. And this is the ultrasonic sensor set up ……….. appears complicated   🙂

setup srf srf


Any suggestion to plot smooth graphs in python  from noisy measurements????


GSoC Weekly Report 2

Last week I spent most of my time reading  documentation and tutorials on Git. Now little confident of my Git repository work.

After having  many trials and failed attempts of plotting acceleration graphs,  yesterday got it  working. feeling happy….

Now this program can be used in many experiments  in mechanics.  Spring oscillations experiment is also ready.

Need to polish the programs add user friendly details on the GUI. It will be a good idea If I can add schematic experimental setup on the GUI itself. It will help students to explore these experiments on their own.

This weeks work in points

  • Got the linear air track polished . problem of friction is partially solved.
  • Code to plot position time graph is completely ready. Need to add comments and commit on GITHUB.
  • First success with acceleration time graph. Need to work on GUI
  • Designed three new experiments with sound waves by manual methods.
  • We need TWO sine wave generators. Ajith Sir  has promised to help with the electronic design. Right now could get sine waves fro microcontroller board connected to expeyes. ( the code is from Kishore A)
  • Need to write detailed reports and daily commits.

Next week I must work more on the repository.

Here is the link

https://github.com/wavicles/Plugins-for-ExpEYES


GSoC weekly report 1

Its the time to write my first weekly report.
This week I continued working on linear air track. The set up is ready but giving some problems due to friction at some points.

Wrote a program  to access SRF05 ultrasonic sensor and could get the first positive result in my lab  [  at my home 🙂  ].

Ajith sir helped me with a call function ‘srfechotime’ to access srf sensor module.

I’d like to improve it and add many things to it to create  a GUI where all the three graphs ( position, velocity and acceleration ).

This week I could also set up experiment with oscillations of spring. Need to modify the srf code to plot Energy graphs from position.

Need to commit these code lines to Git.


Problems/goals

  • Motion sensor got spoiled ( may be due to wrong connection) need to find out the exact reason so that this can be avoided from happening again.
  • There is little friction at some points on linear air track. Need to get it polished.
  • Faced problems in calculating acceleration and plotting it against time.

Since I am a  beginner in the field of programming, I need to work really hard on the following things

  • Get familiar with  Github procedures.
  • Work on Designing GUI using python ( Currently not able to alter the graph scale )
  • Documentation of all experiments in detail.
  • Commenting in the code.