Saturday, 21st June 2014

Today worked on an experiment to produce Lissajous figures using two square waves. Wrote Program in python and tested the same. Could obtain various Lissajous patterns.

In the code we used Capture2 function from ExpEYES library to plot the figures. Here is the example…

_________________________________________________________________________

from pylab import *
import expeyes.eyesj
p = expeyes.eyesj.open()
from pylab import *
t1,v1,t2,v2 = p.capture2(1, 2, 300, 100)
figure(1)
plot(t1,v1)
figure(2)
plot(t1,v1, t2,v2)
figure(3)
plot(v1,v2)
show()

__________________________________________________________________________

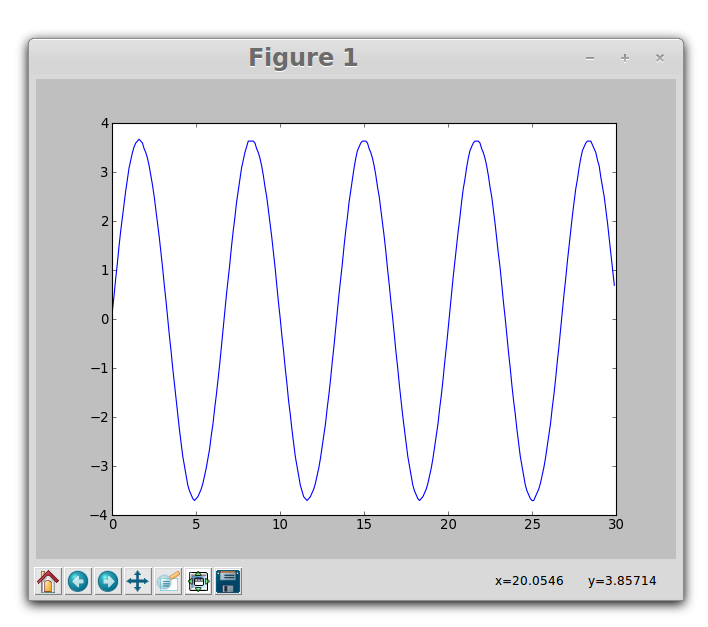
figure 1 is a sine wave connected to channel A1
sine

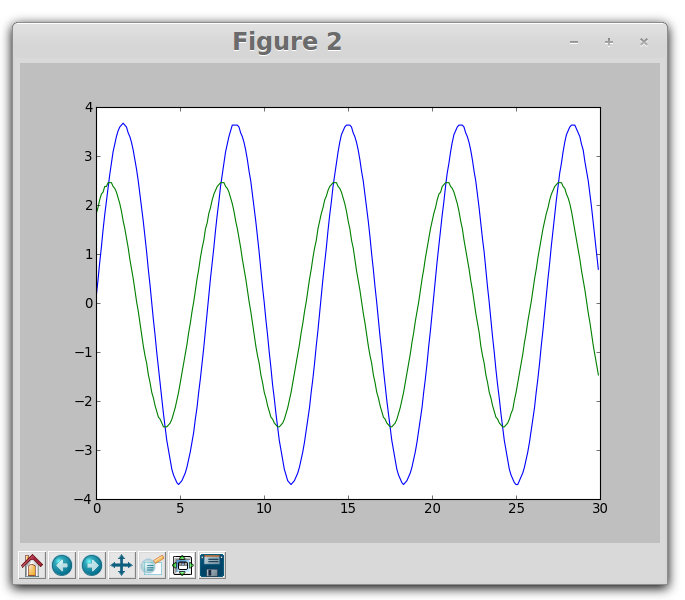
figure2 shows the phase different introduced using a 1 microfarad capacitor and 1kilo ohm resistor.
lisawaves

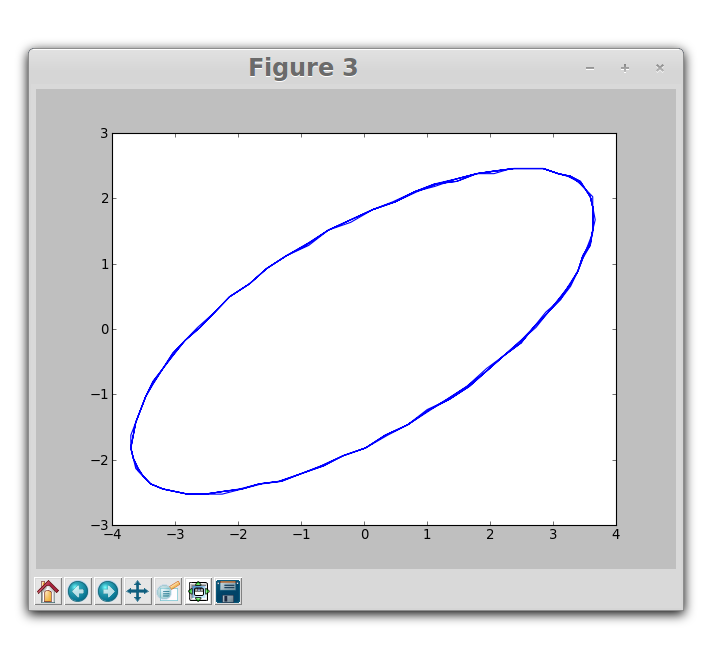
this is the resulting Lissajous pattern…..
lissaellipse

Need to create a GUI where user can change the phase between the two waves and can obtain different patterns.

Tomorrow I will be working on the same experiment to produce different patterns.

 Following is the related information

Source :

  1. http://www.britannica.com/EBchecked/topic/343305/Lissajous-figure
  2. http://en.wikipedia.org/wiki/Lissajous_curve

Lissajous figure, also called Bowditch Curve, pattern produced by the intersection of two sinusoidal curves the axes of which are at right angles to each other.

If the frequency and phase angle of the two curves are identical, the resultant is a straight line lying at 45° (and 225°) to the coordinate axes. If one of the curves is 180° out of phase with respect to the other, another straight line is produced lying 90° away from the line produced where the curves are in phase (i.e., at 135° and 315°).

Otherwise, with identical amplitude and frequency but a varying phase relation, ellipses are formed with varying angular positions, except that a phase difference of 90° (or 270°) produces a circle around the origin. If the curves are out of phase and differing in frequency, intricate meshing figures are formed.

The appearance of the figure is highly sensitive to the ratio a/b. For a ratio of 1, the figure is an ellipse, with special cases including circles (A = B, δ = π/2 radians) and lines (δ = 0). Another simple Lissajous figure is the parabola (a/b = 2, δ = π/4). Other ratios produce more complicated curves, which are closed only if a/b is rational. The visual form of these curves is often suggestive of a three-dimensional knot, and indeed many kinds of knots, including those known as Lissajous knots, project to the plane as Lissajous figures. (REF: http://en.wikipedia.org/wiki/Lissajous_curve)

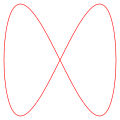
  • a = 1, b = 2 (1:2)
  • a = 3, b = 2 (3:2)
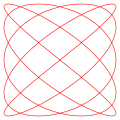
  • a = 3, b = 4 (3:4)
  • a = 5, b = 4 (5:4)
Friday, 20th June 2014

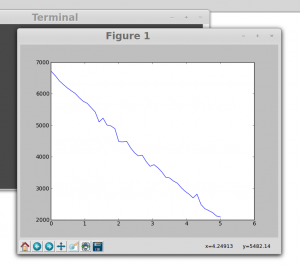
Continued working on the experiments. Here are the screen shots of the experiment with spring oscillations..

Screenshot from 2014-06-21 00:04:36

Screenshot from 2014-06-20 23:55:05

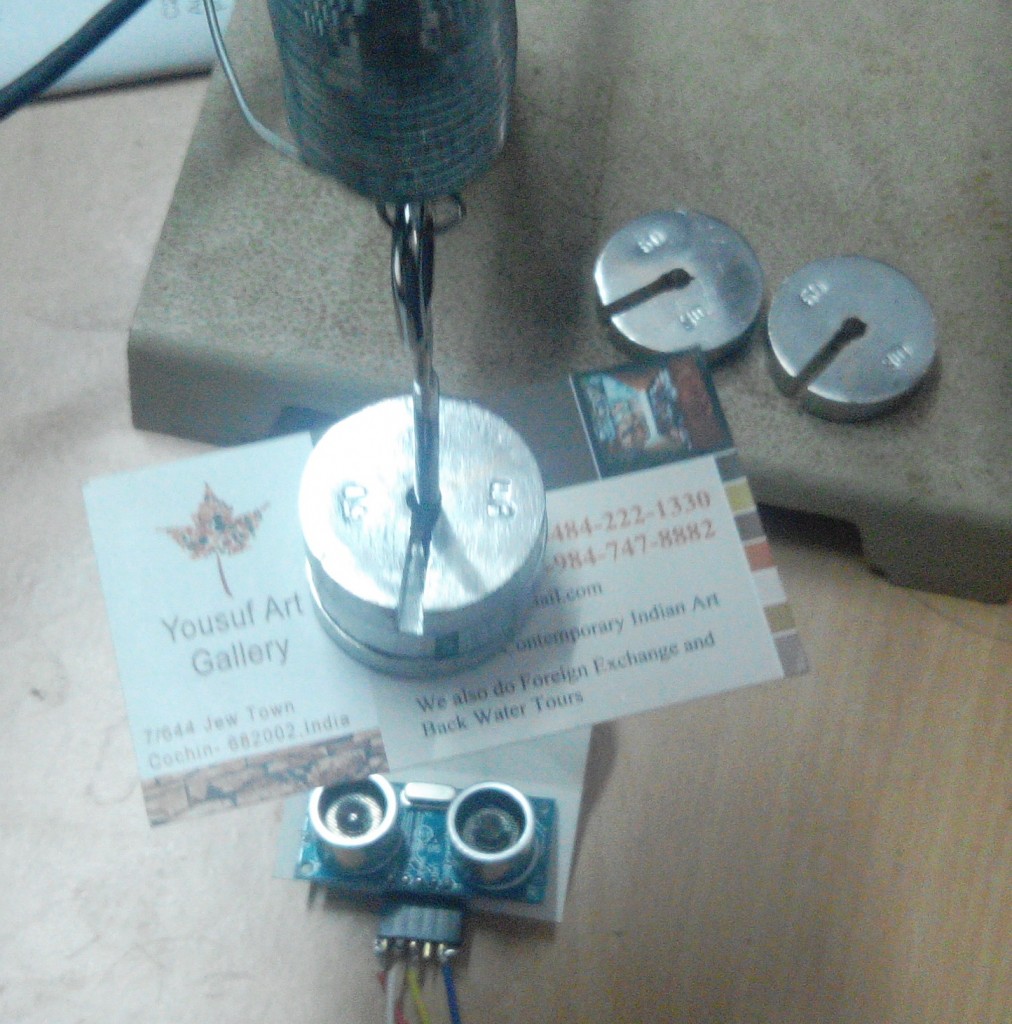
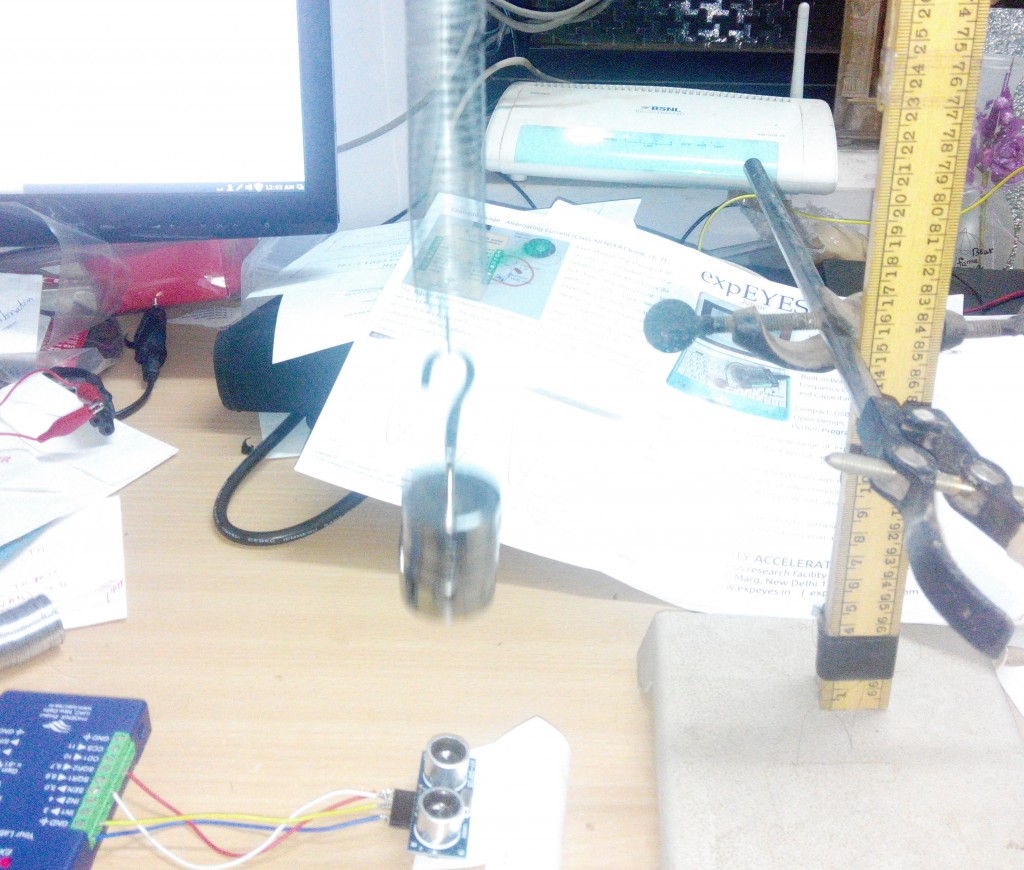
This is the experimental setup…
IMG_20140620_234908
IMG_20140621_000239

Plots obtained are good. Now we need to write python code to fit the curve and get the frequency.
Form the frequency and the load attached to the spiral spring, its Force constant or Spring constant can be determined.

One more positive development that has happened is…now we are able to access ExpEYES with android phone or tablets….Thanks to Jitin B.P. for this application.

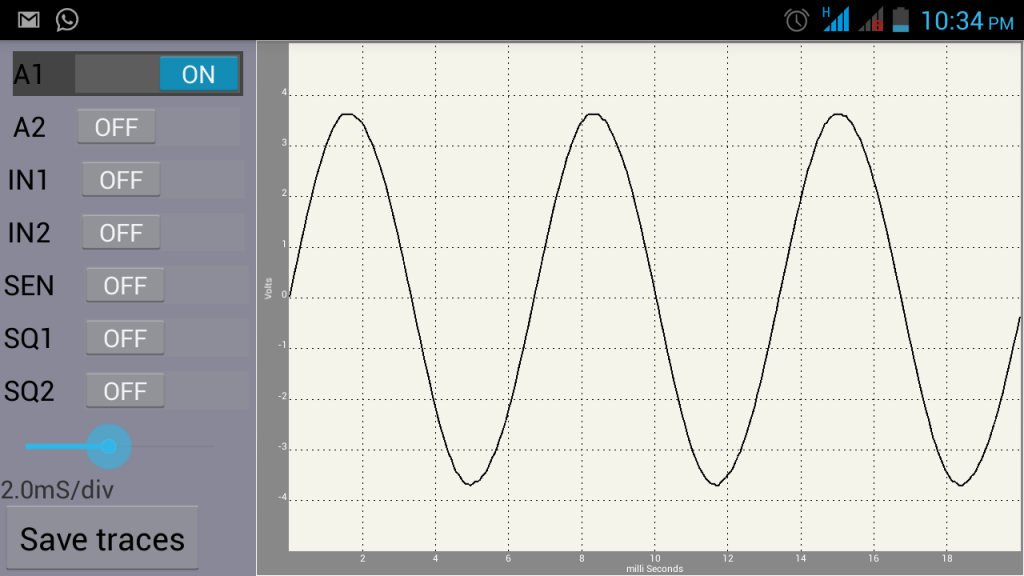
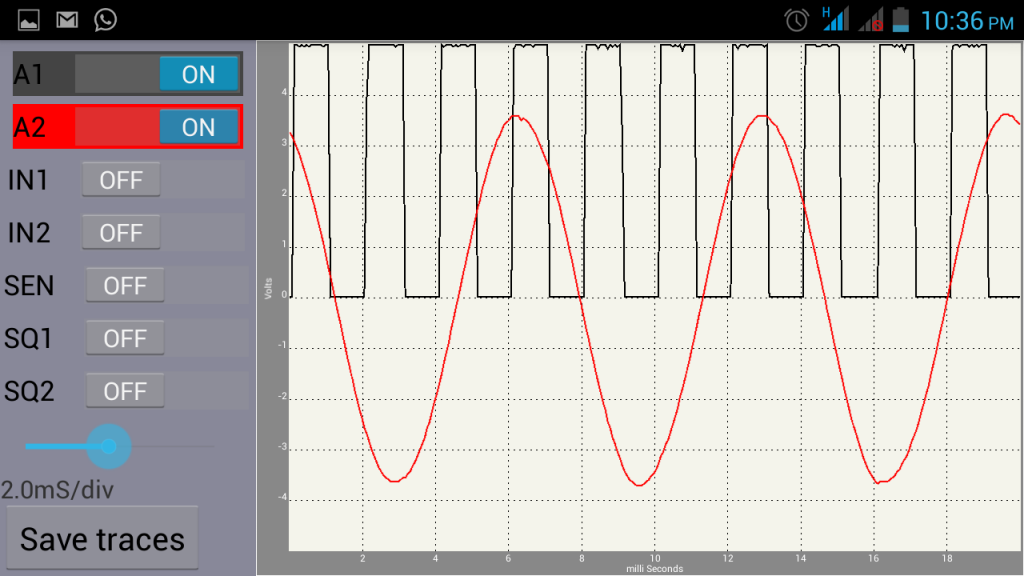
I could connect ExpEYES to my Micromax Canvas 4 Phone…the screen shots shows sine waves and squarewaves connected to different channels….Screenshot_2014-06-20-22-34-15
Screenshot_2014-06-20-22-36-15

I have also added some simple python programs required for time measurements and plots to git repo.

Thursday, 19th June 2014

Continued working on giving finishing touch to the experiments which I have started yesterday.
There is a good progress. I will be able to complete this work by tomorrow evening.
Had to spend a lot of time with photo-gates. The problem in accessing Light sensors (Photogates) is solved……… 🙂
Now I am able to make time measurements using these light sensors.Need to prepare a detailed report with screen shots and pics of the experimental arrangements.

Wednesday, 18th June 2014

Today I have started giving finishing touch to the following experiments.
1. Frequency of Oscillations of Spiral Spring

2. Parallel and series combination helical springs and the resulting spring constant.

2. Uniformly accelerated motion on an inclined plane
3. Conservation of momentum.

For all these experiments  I am using a photo-gate (Light-sensor) and motion detector (Ultrasonic Sensor). The code written for ultrasonic sensor is giving all the required result. Facing difficulties in accessing two photogates…. working on this issue since last week …..
………once this problem is solved we will get wonderful results from these experiments.

Tuesday, 17th June 2014

Today I continued to  work with Documentation. Received additional Ultrasonic sensors SRF 05  today by courier. Did the testing work for all ten pieces of srf modules. They all are working good.

Now I can apply all trial and error methods to explore…… 🙂

Wrote three programs for time measurement using photo-gates and explored the use of time measurement functions like r2rtime r2f time and multir2rtime and updated changes to Git repo.

Facing some difficulties in an experiment while using two photo-gates simultaneously for time measurements. One gate can be connected to SEN input of ExpEYES. Tried the other gate with IN1 and IN2 …it did not work. Need to study functioning of this gate and inputs IN1 and IN2.

Last time when I did this experiment, apparently it worked, I did use the old photo-gate(the design of the old photogate is different than the new one). We must find a way to use the new photo gate as its design is simple ( no extra transistor), with terminal other than SEN. I am studying this programmers manual and user manual to explore the possibilities…..


There are some

Monday, 16th June 2014

Today started creating documents for experimental setups and procedures. This week I have set a target for myself that I must complete documentation work for at least five mechanics experiments and a few sound experiments. I have already prepared draft copies …

Edited programs for using SRF 05 sensor. Did the experiments on linear air track to obtain position -time plots.

Graph for body moving towards the sensor with constant velocity.

constant velocity


Graph for body moving away from  the sensor with constant velocity.


pt graphconstantvelocity


A body bouncing off from a point near the sensor…

pt graphbounce


We should now try for avoiding irregular peaks in the readings.

GSoC Weekly Report 4

This week ( From Monday 9th to Sunday, 15th June 2014) we really accelerated working with experiments and coding.

Constant encouragement and guidance from my mentors, Mario Behling and Dr. Ajith Kumar really helped me to keep going.

What We Could Do….

  • Attempted to use two Ultrasonic sensors simultaneously to detect position. Used two srf05 modules to plot graphs. Both the graphs were out of phase as expected. This is very much useful for momentum transfer  experiments involving collision. Uploaded the code to Github Repo.
  • Explored different methods of determining velocity and acceleration. Used the same set up of linear track in inclined position at about 45 degrees. Allowed vehicle to glide downwards and plotted position-time graph. Got straight line with positive slope as expected. For this used SRF05 module.
  • Then used photo-gate with ExpEYES kit and could make time measurements.
  • Designed a pickup device  for use with photogate. ( Thanks to Open Educational Resources on the web)
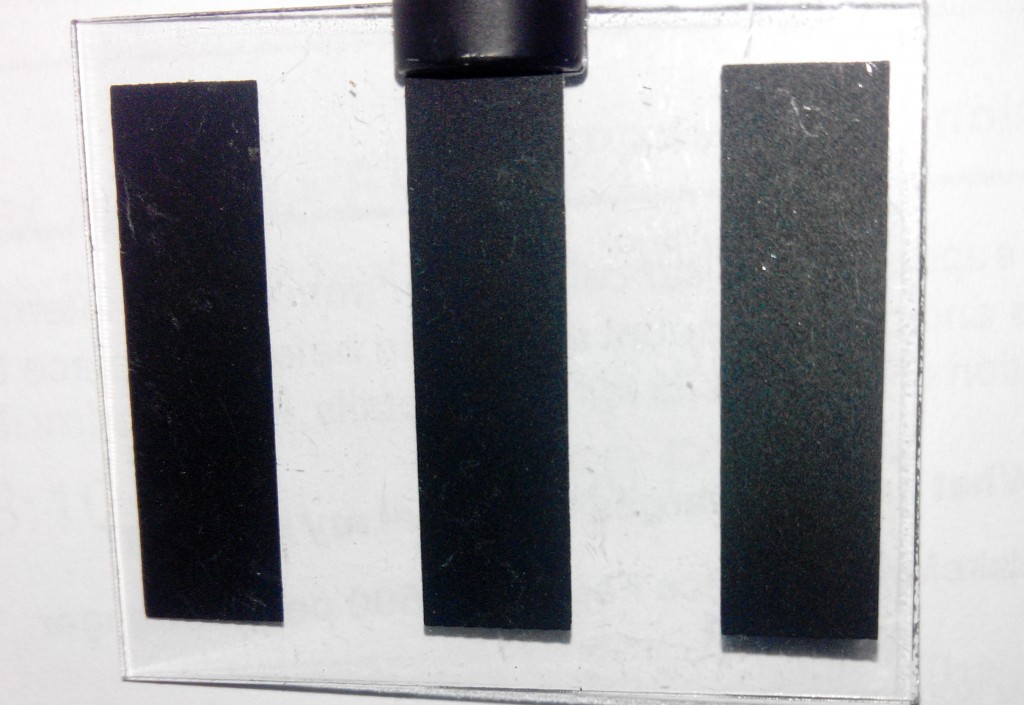
  • pickup for accelerationThis can generate a square wave as it passes through photogate. Acceleration can be determined  using the signal generated. Excited to see its working. Some proprietary closed source devices use this method……….( of course they come at a very high cost price). This will result in a very low cost setup
  • This is the photo gate used. (photo from www.expeyes.in)
  • light-barrier


  • Modified the photo-gate design  so that it will be easy to use with linear air track set-up.
  • Today tried to measure acceleration due to gravity using motion of glider on an inclined plane. Used the pickup i designed yesterday and photo-gate to measure acceleration. The results are very good and are in close agreement with theoretical calculations. For motion on an incline acceleration along the inclined plane is g’ = g sin(theta) where (theta) is the angle on inclination. wrote a small python code using time measurement functions of ExpEYES library.
  • Used these time measurement functions:
      • p.multi_r2rtime(3)  # time for 1 cycle
      • p.multi_r2rtime(3,2)  #time for  4 cycles, 2 rising edges are skipped
  • Now we can do the acceleration due to gravity measurement with two different methods
    1. By using motion sensor …. the data is recorded with uniform time intervals.
    2. By using Photo-gates …… the time intervals are not uniform. time taken for traveling different distances can be measured and data can be used to calculate acceleration.
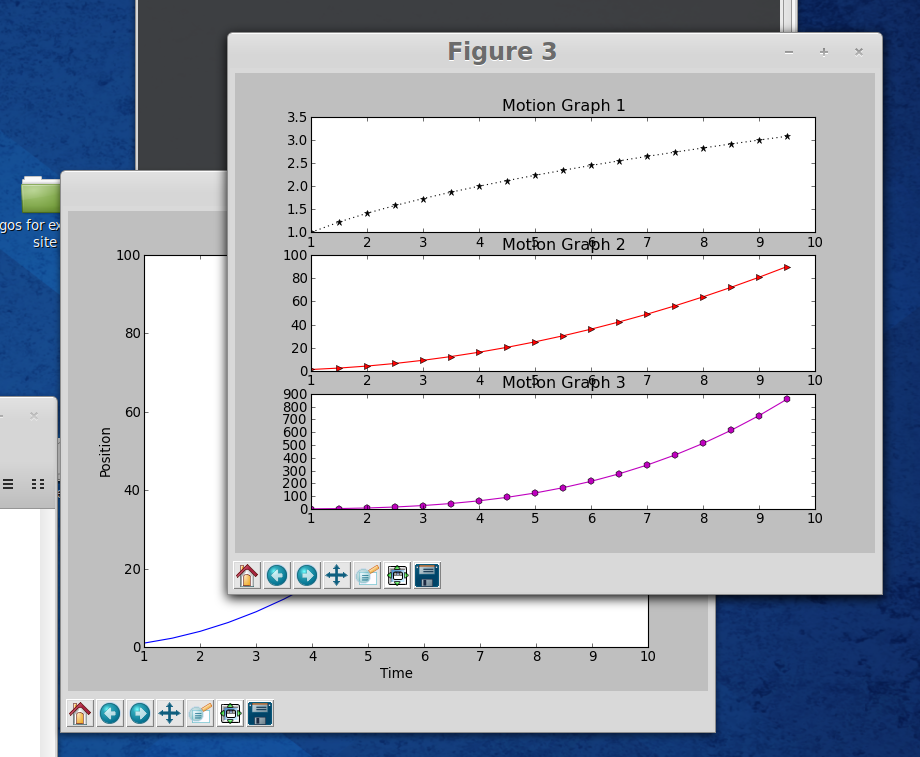
  • Worked on  plotting 2D graphs using ‘matplotlib’ library.  Matplotlib is a python 2D plotting library which produces publication quality figures in a variety of formats and interactive environments across platforms. I found it to be a very powerful tool for teaching and learning physics.  Wrote code for plotting different graphs useful for mechanics experiments. Here are some screen shots….

ucm and shmgraph2

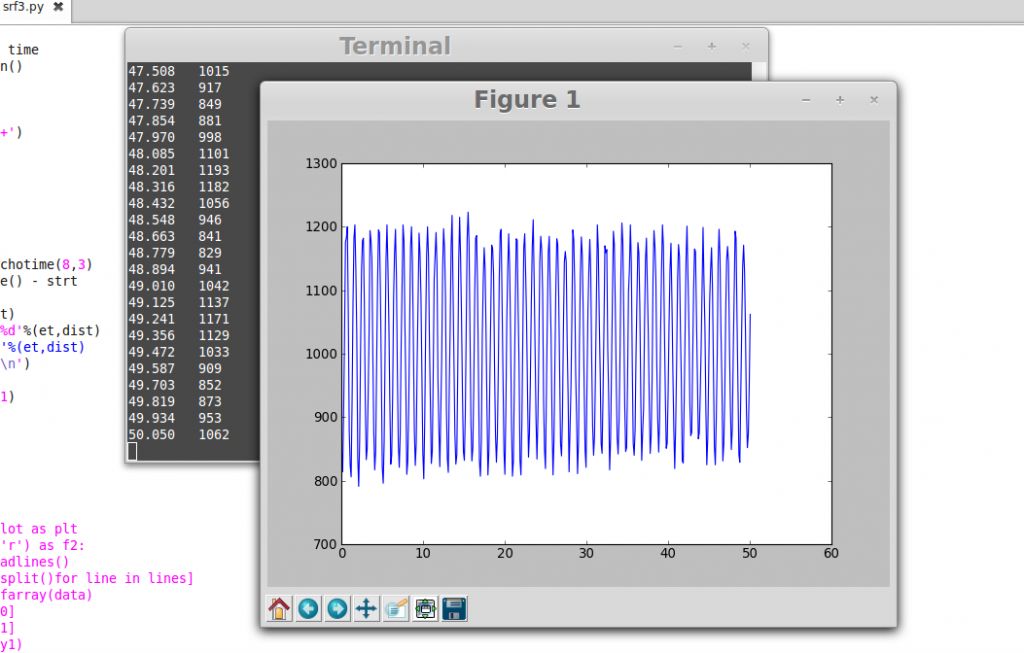
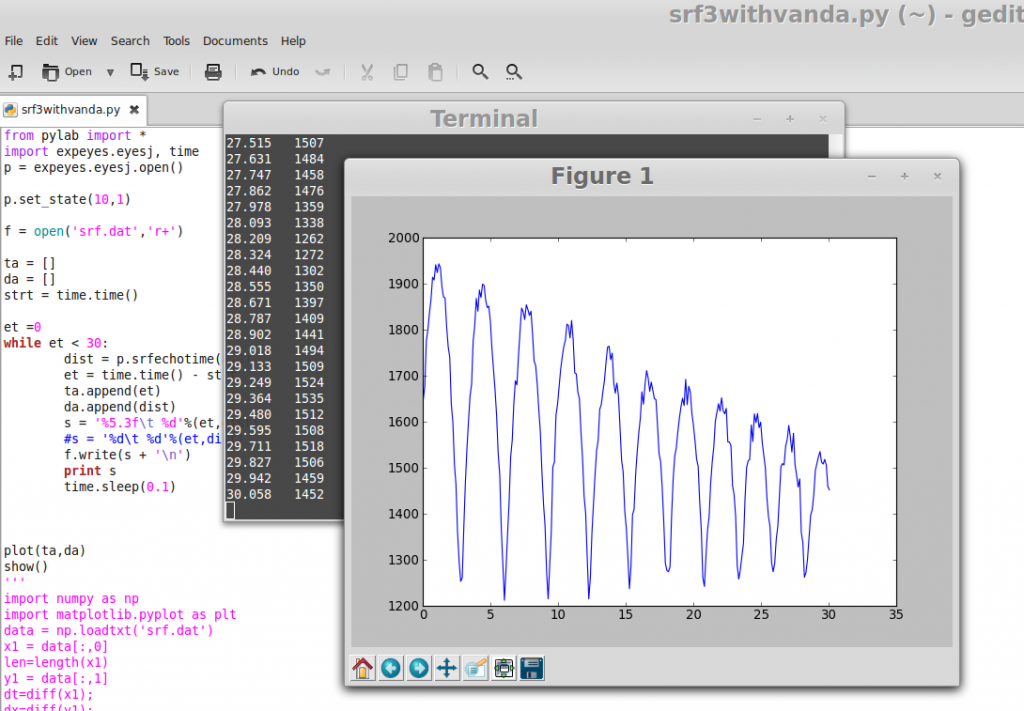
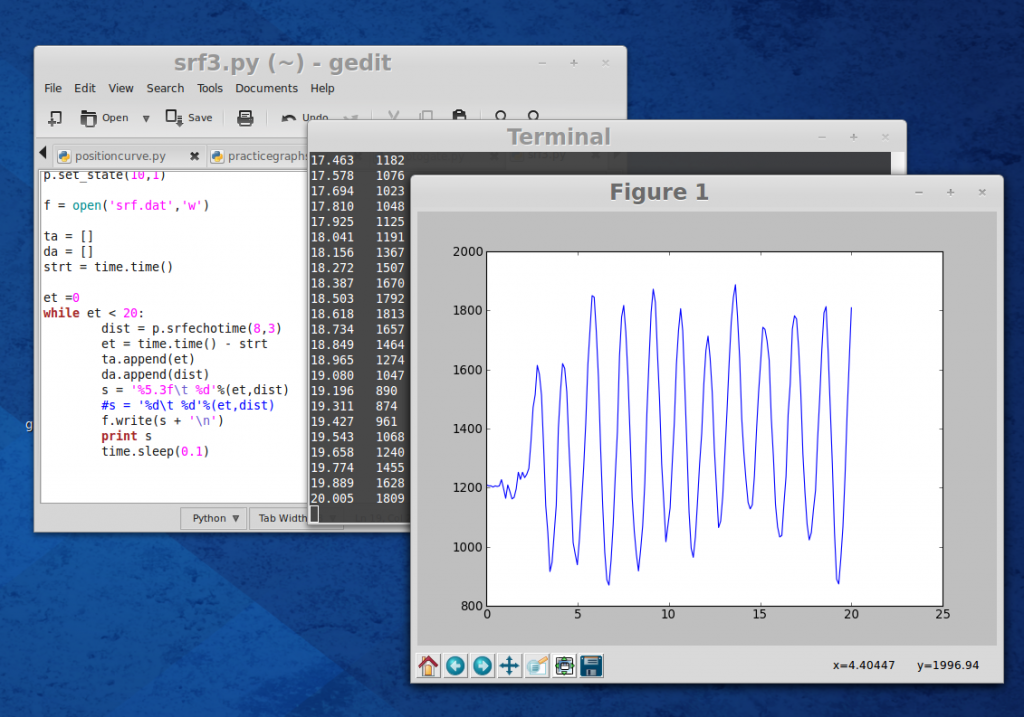
  • Data ( time and position) obtained from Ultrasonic sensor is stored in a file srf.dat and then plotted. I just moved a piece of paper to and fro, in-front of the sensor. Plot is reasonably good.  In another trial fetched  data from the file and plotted….matplotlib is amazing … :)

srf3graphssrfdataplot

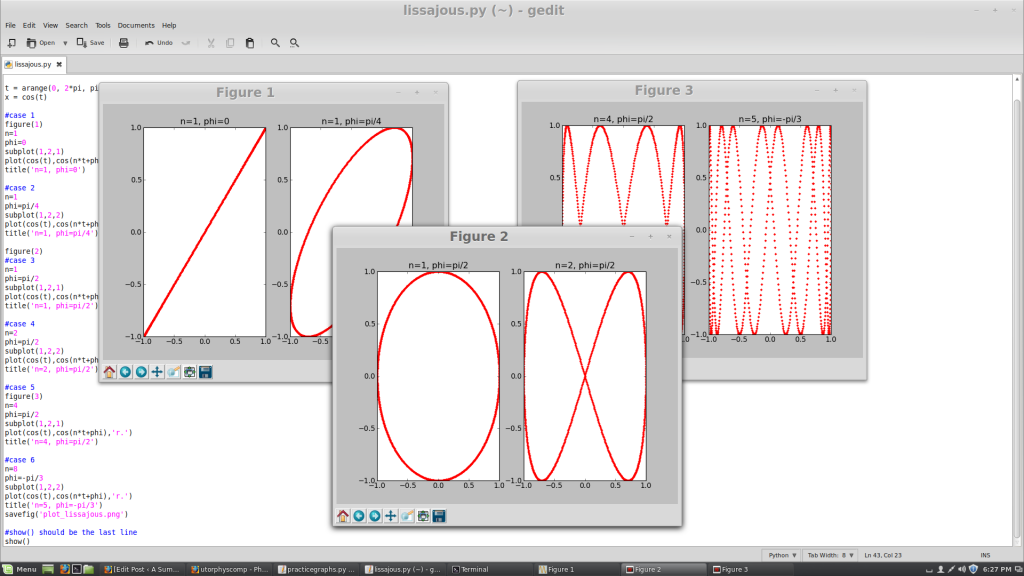
  • Tried plotting Lissajous figures…..this code will be useful for my sound experiments……beautiful yet simple….its python… :)

liss


Difficulties Faced
  • Numerical Differentiation for calculation in mechanics
  • Acceleration Graphs  are scattered and lack accuracy in measurement.
  • Calculation of acceleration using Photo-gate and pickup device

To Do Next Week

  • Coming week I will be focusing giving finishing touch to the individual  experiments….
  • Documentation with experimental procedure for the experiments developed
  • Taking Photos/Videos of set up and also upload screen shots.
  • Develop code to Access all the experiments through single GUI
  • Finalize the codes for individual experiments on Github
  • Prepare for mid-term evaluation


here is my git activity for this week   https://github.com/wavicles/Plugins-for-ExpEYES/commits/master

Sunday, 15 June 2014

Coding …. coding and Coding…

Since yesterday I am working on  Plotting Graphs.

Here are some screen shots of my trials

srf3graph


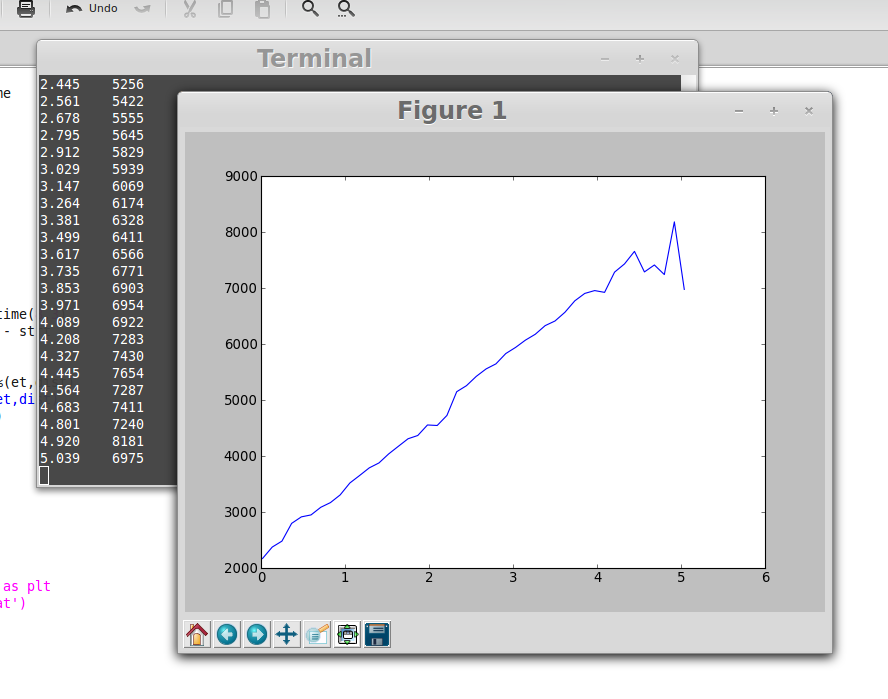
Data ( time and position) obtained from Ultrasonic sensor is stored in a file srf.dat and then plotted. I just moved a piece of paper to and fro, in-front of the sensor. Plot is reasonably good.


In another trial fetched  data from the file and plotted….matplotlib is amazing … 🙂

ssrfdataplotNeed to debug the errors…..to get subplots…

Also tried plotting Lissajous figures…..this code will be useful for my sound experiments…….beautiful yet simple….its python… 🙂

liss

Coming week I will be focusing giving finishing touch to the experiments….

here is my git activity for today  https://github.com/wavicles/Plugins-for-ExpEYES/commits/master

Saturday, 14 June 2014

My experimental setup for few mechanics experiments is ready and I am getting good results in terms of motion graphs.

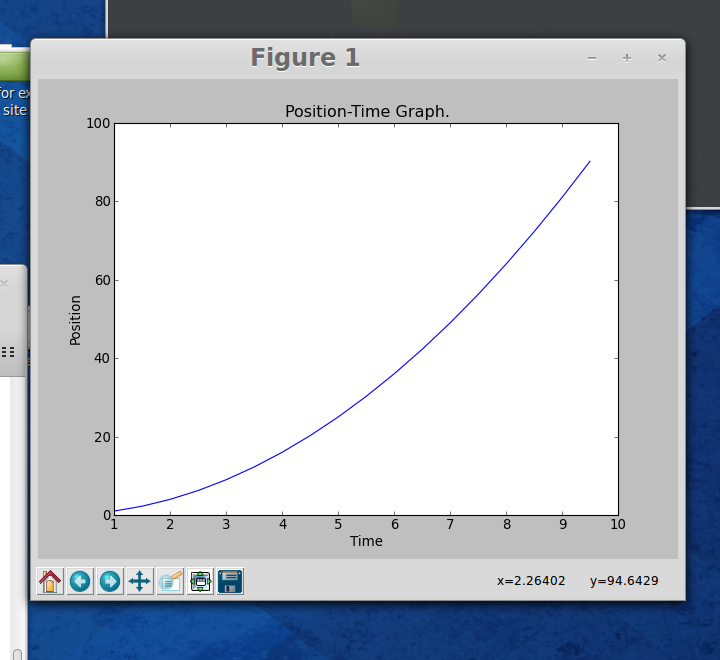
Today studied and tried plotting 2D graphs using ‘matplotlib’ library. Matplotlib is a python 2D plotting library which produces publication quality figures in a variety of formats and interactive environments across platforms. I found it to be a very powerful tool for teaching and learning physics. Here are some screen shots……

A simple Position -time graph

pt graphgraph1

Here is an example showing relation between Uniform circular motion and Simple Harmonic Motion. Projection of UCM is SHM

ucm and shm

Plotting subplots

graph2


Here is the link for these programs on my Github repository


Friday, 13th June 2014

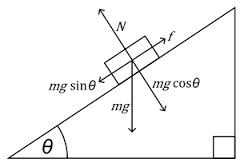
gravity inclineThis is a schematic diagram for the acceleration experiment I am working on.

Acceleration measured in this experiment is the sine component of ‘g’.

So now we can do this experiment by two methods.

  1. By using motion sensor …. the data is recorded with uniform time intervals.
  2. By using Photo-gates …… the time intervals are not uniform. time taken for traveling different distances can be measured and data can be used to calculate acceleration.