
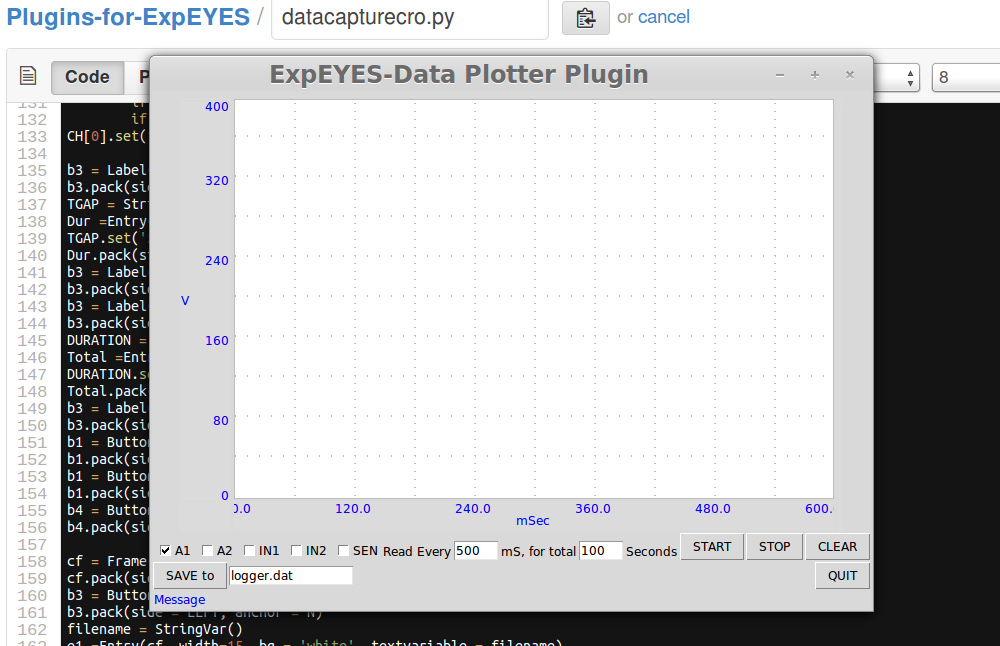
For accessing Data from all channels of ExpEYES we need a GUI which can plot graphs, something like a data logger. Today I started working on python code to develop a GUI to assess channels A1, A2, IN1, IN2 and SEN. Used the program written by Dr. Ajith Kumar as the base and started developing the code. Spent a lot of time …..happy that the result is awesome…..
One strange thing is happening. If I touch a wire attached to A1. I am getting a waveform similar to beats in sound. Need to explore and find the reason.
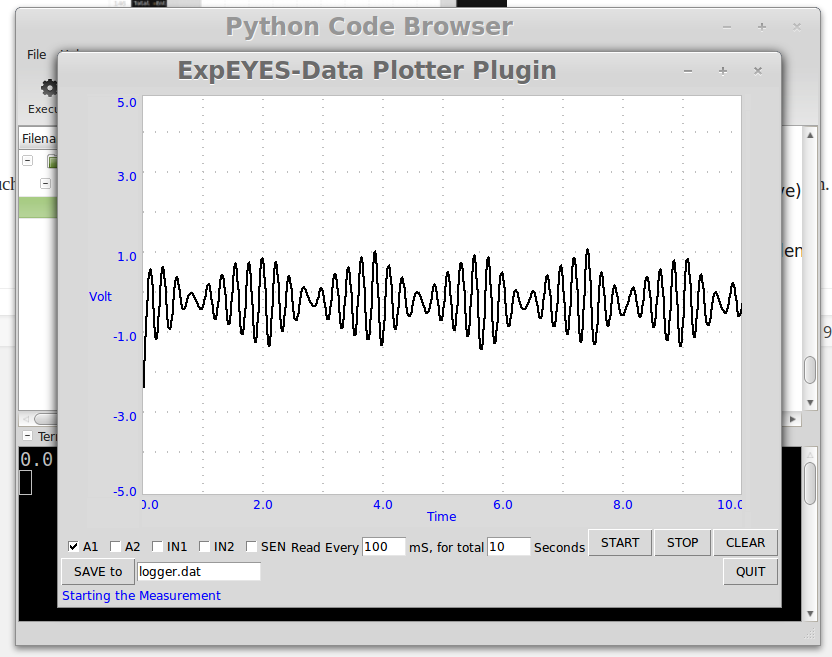
With this GUI we can fetch data from any channel and save it to a dat file and see the plot in real time. It is time to forget all costly and closed source dataloggers…..ExpEYES can do a better job….most affordable…..open source….respects your freedom….. 🙂 My mentors will be very happy to see this….:)