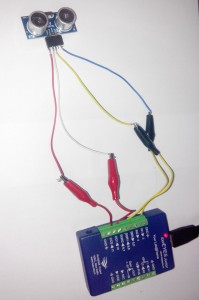
Yesterday night I tried to plot graphs using the time and position data obtained from SRF 05 sensor. I just moved a notebook in-front of the sensor, up and down and could plot position against time . But the plots were little noisy and giving unusable estimates of the acceleration.
Today spent time to understand some filtering techniques.
Google Search led me to the Kalman filter which is is a mathematical method that uses noisy measurements observed over time to produce values that tend to be closer to the true values of the measurements and their associated calculated values.
I have downloaded some docs on filtering techniques and now I am studying them. I think I should take help from my mentors and fellow coders from FOSSASIA………
Before I go to sleep will try to finish the setup to generate sine waves for sound experiments……..Its almost ready …..:)
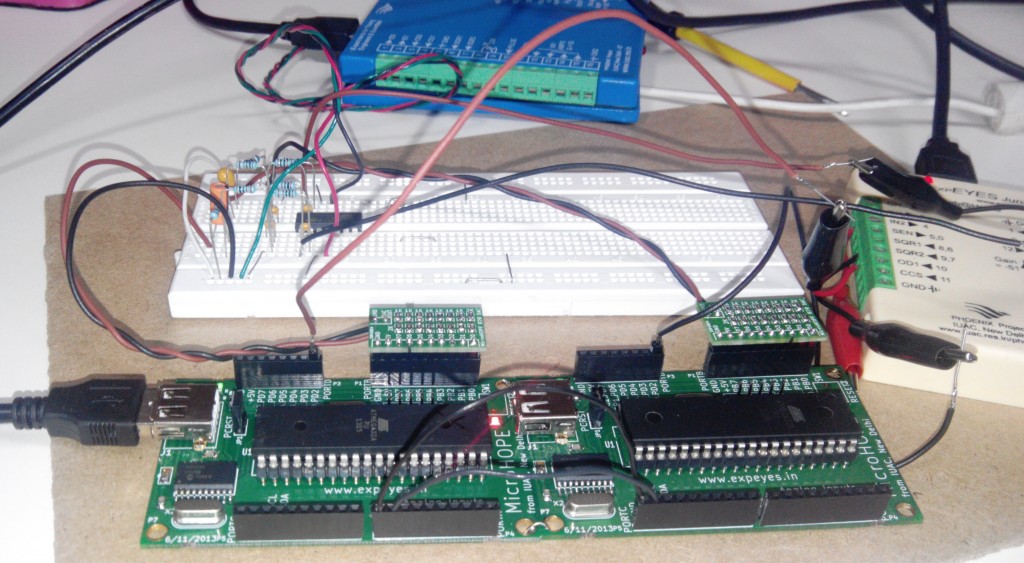
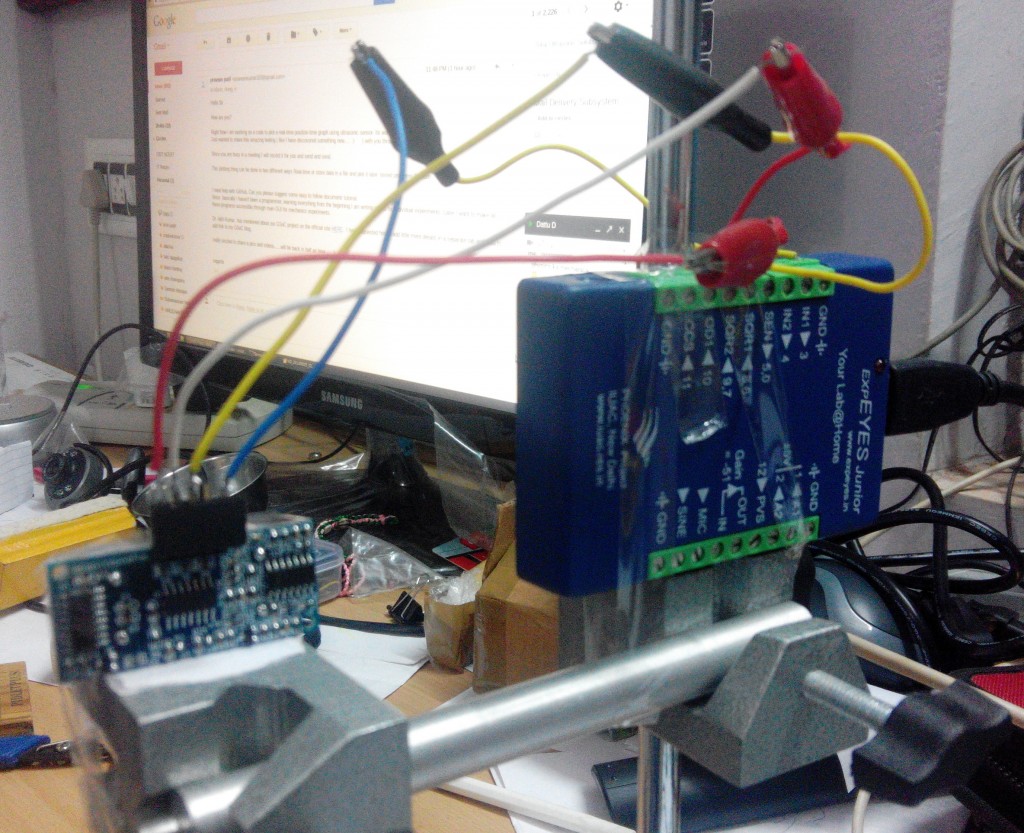
Used two microHope boards to convert square wave into a sine wave. And this is the ultrasonic sensor set up ……….. appears complicated 🙂
Any suggestion to plot smooth graphs in python from noisy measurements????