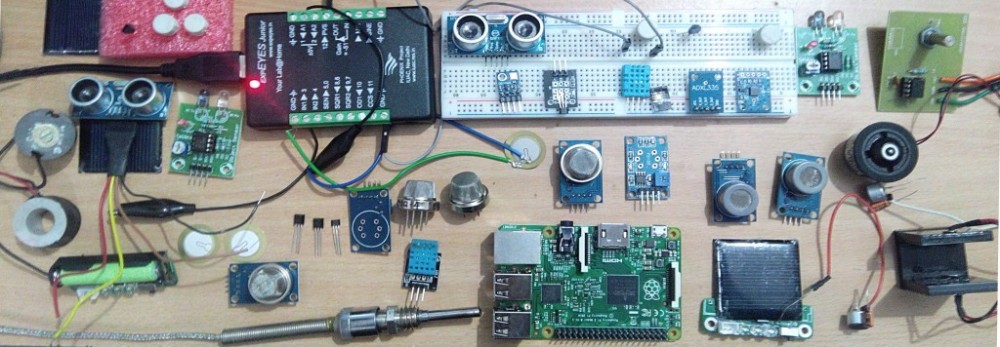
Chladni pattern is a n interesting example of Simple harmonic Motion. Today I devised a setup to produce these patterns using ExpEYES.
In Chladni patterns, points in an object undergo SHM with varying amplitudes. There will be some points where amplitude of SHM is zero, called nodes. If Small particles (sand / rangoli powder) are spread on the plate, they collect at the nodes, ie along lines where the amplitude of SHM is small.
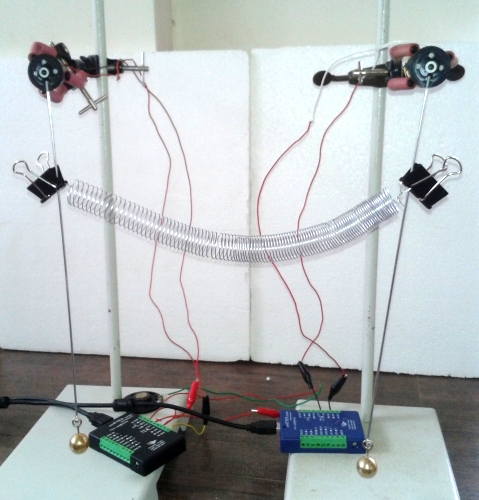
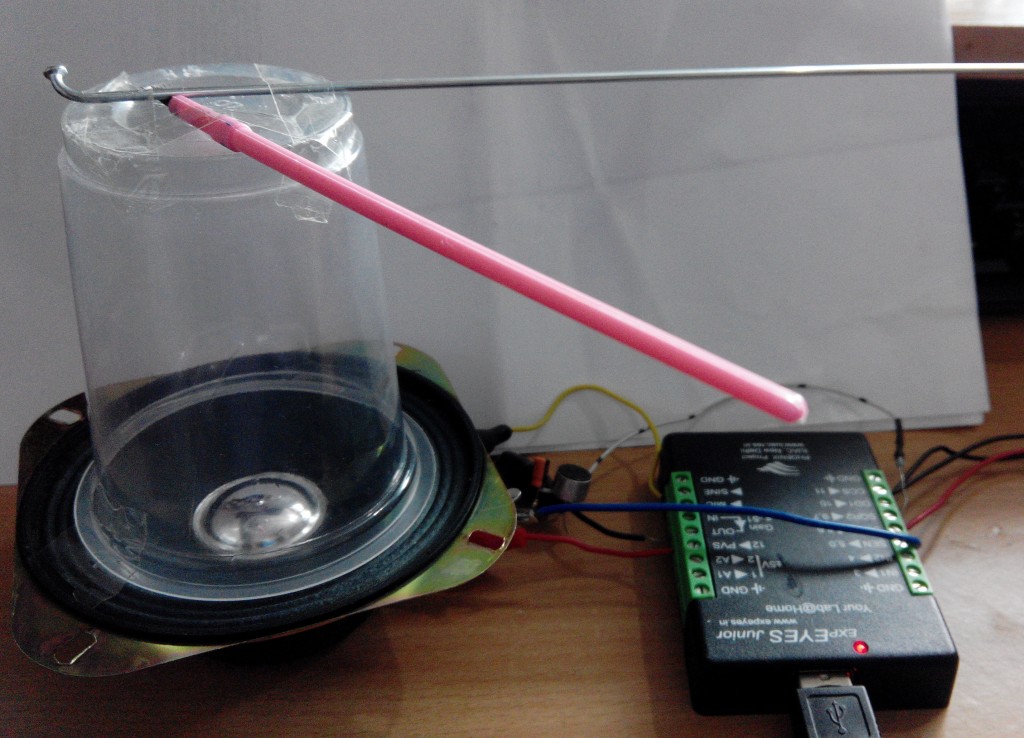
For the experimental Set-up I used a CD as Chladni plate. SQR1 is connected to a small inductor (a coil of wire with no magnetic core) and produces a sinusoidal magnetic field. This is then placed close to a small magnet attached to the plate, and so produces a sinusoidal force on the magnet.
Two small magnets are placed on the edge of the plate. The inductor is placed so its centre is directly beneath the magnets and as close as possible to the plate without touching it.
Used python program to change frequency of SQR1.